
About this printable
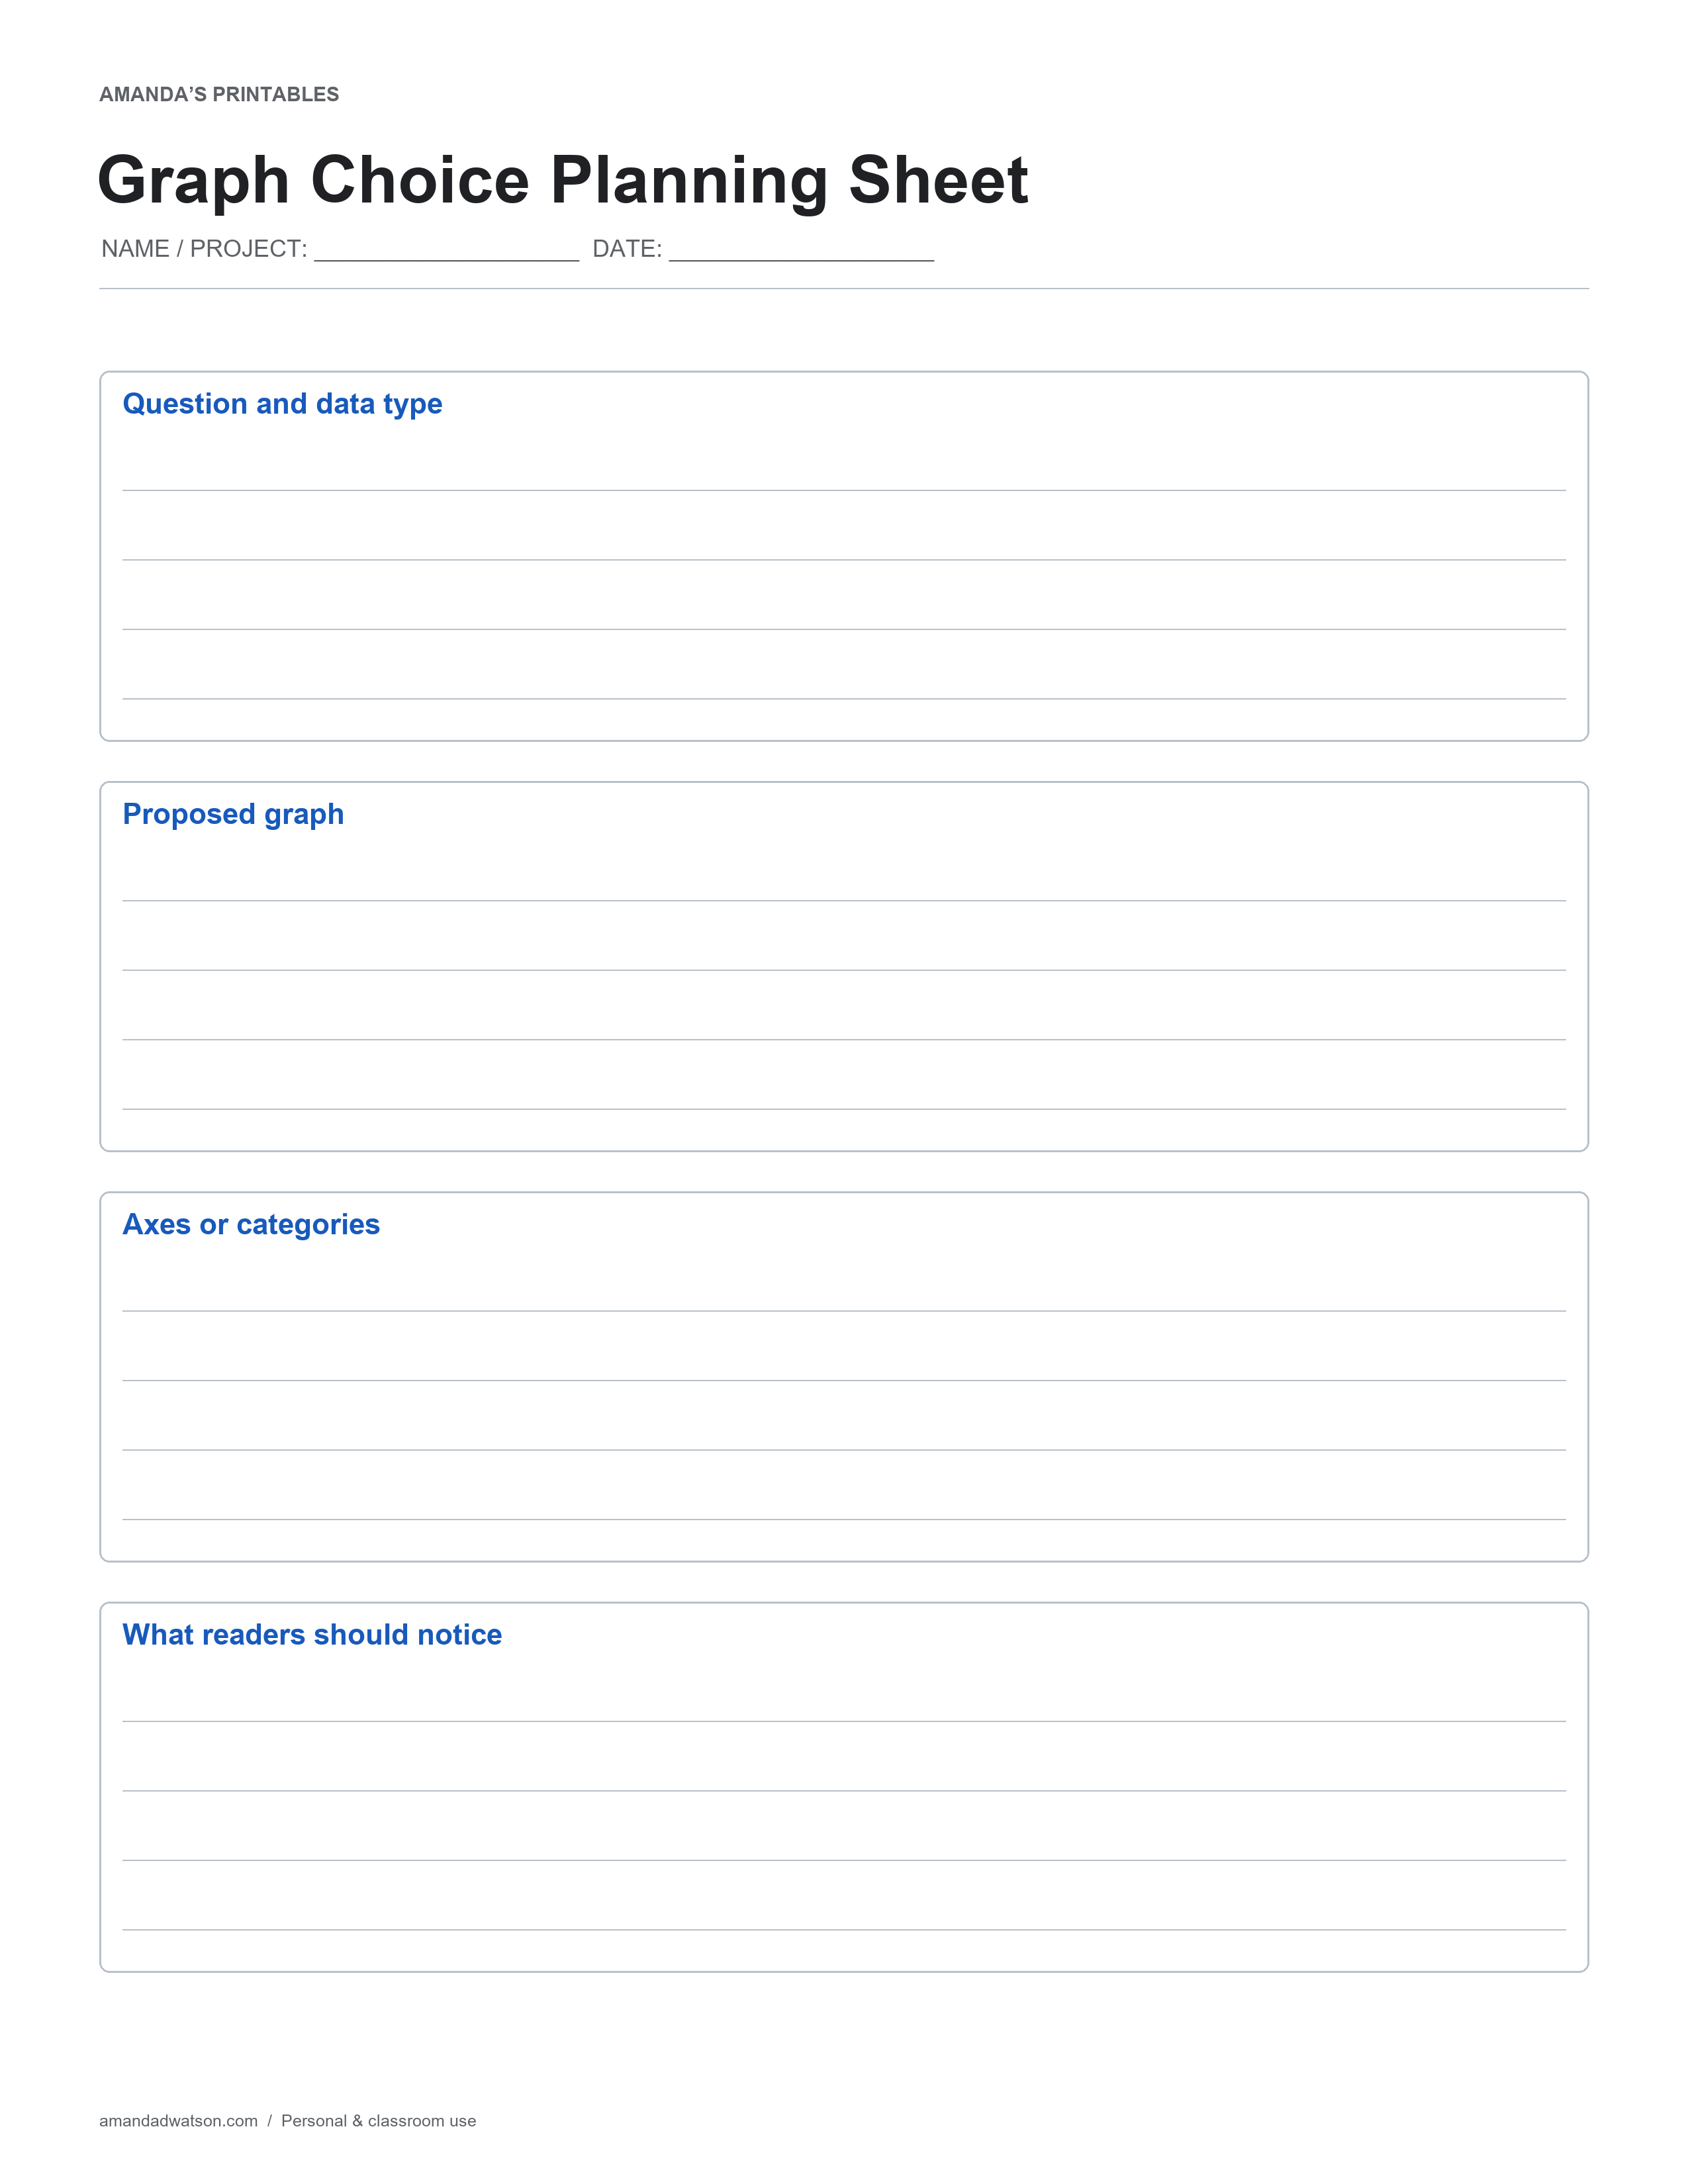
Choose a graph based on the question and the kind of data available. This planning sheet asks for a reasoned choice before drawing a polished chart.
How to use it
Describe whether your values compare categories, track change or show paired measurements. A count of books by genre may suit a bar chart, while a sequence of daily measurements may suit a line graph. Write the labels and units before sketching the display.
Check and adapt
Check that the graph does not suggest a relationship the data cannot support. Consider the scale and whether connecting points is meaningful. Use the final section to state a cautious observation, keeping explanation of causes separate from what the graph directly shows.
Download and printing instructions
Use Download image to save the original high-resolution PNG. To make a PDF, choose US Letter or A4 below the image and select Download PDF. The website creates that file in your browser; no separate PDF attachment is needed. Match the printer paper setting to your choice, use uniform scaling and check that every edge fits inside the printable area. Print one test copy before making a classroom set. These are flat printable pages, not editable forms. Originals are for personal and classroom use; share the article link rather than redistributing the files.