
This free printable helps learners read a numbered bar-graph scale, compare two values, total a small data set and test a claim against the evidence. It includes a complete student worksheet and a separate worked answer page, with original diagrams and checked solutions.
Who this worksheet suits
Learners need addition and subtraction with whole numbers and an understanding of “twice.” The chart uses an invented school weather station, so the focus stays on reading data rather than remembering weather facts.
What is on the student page
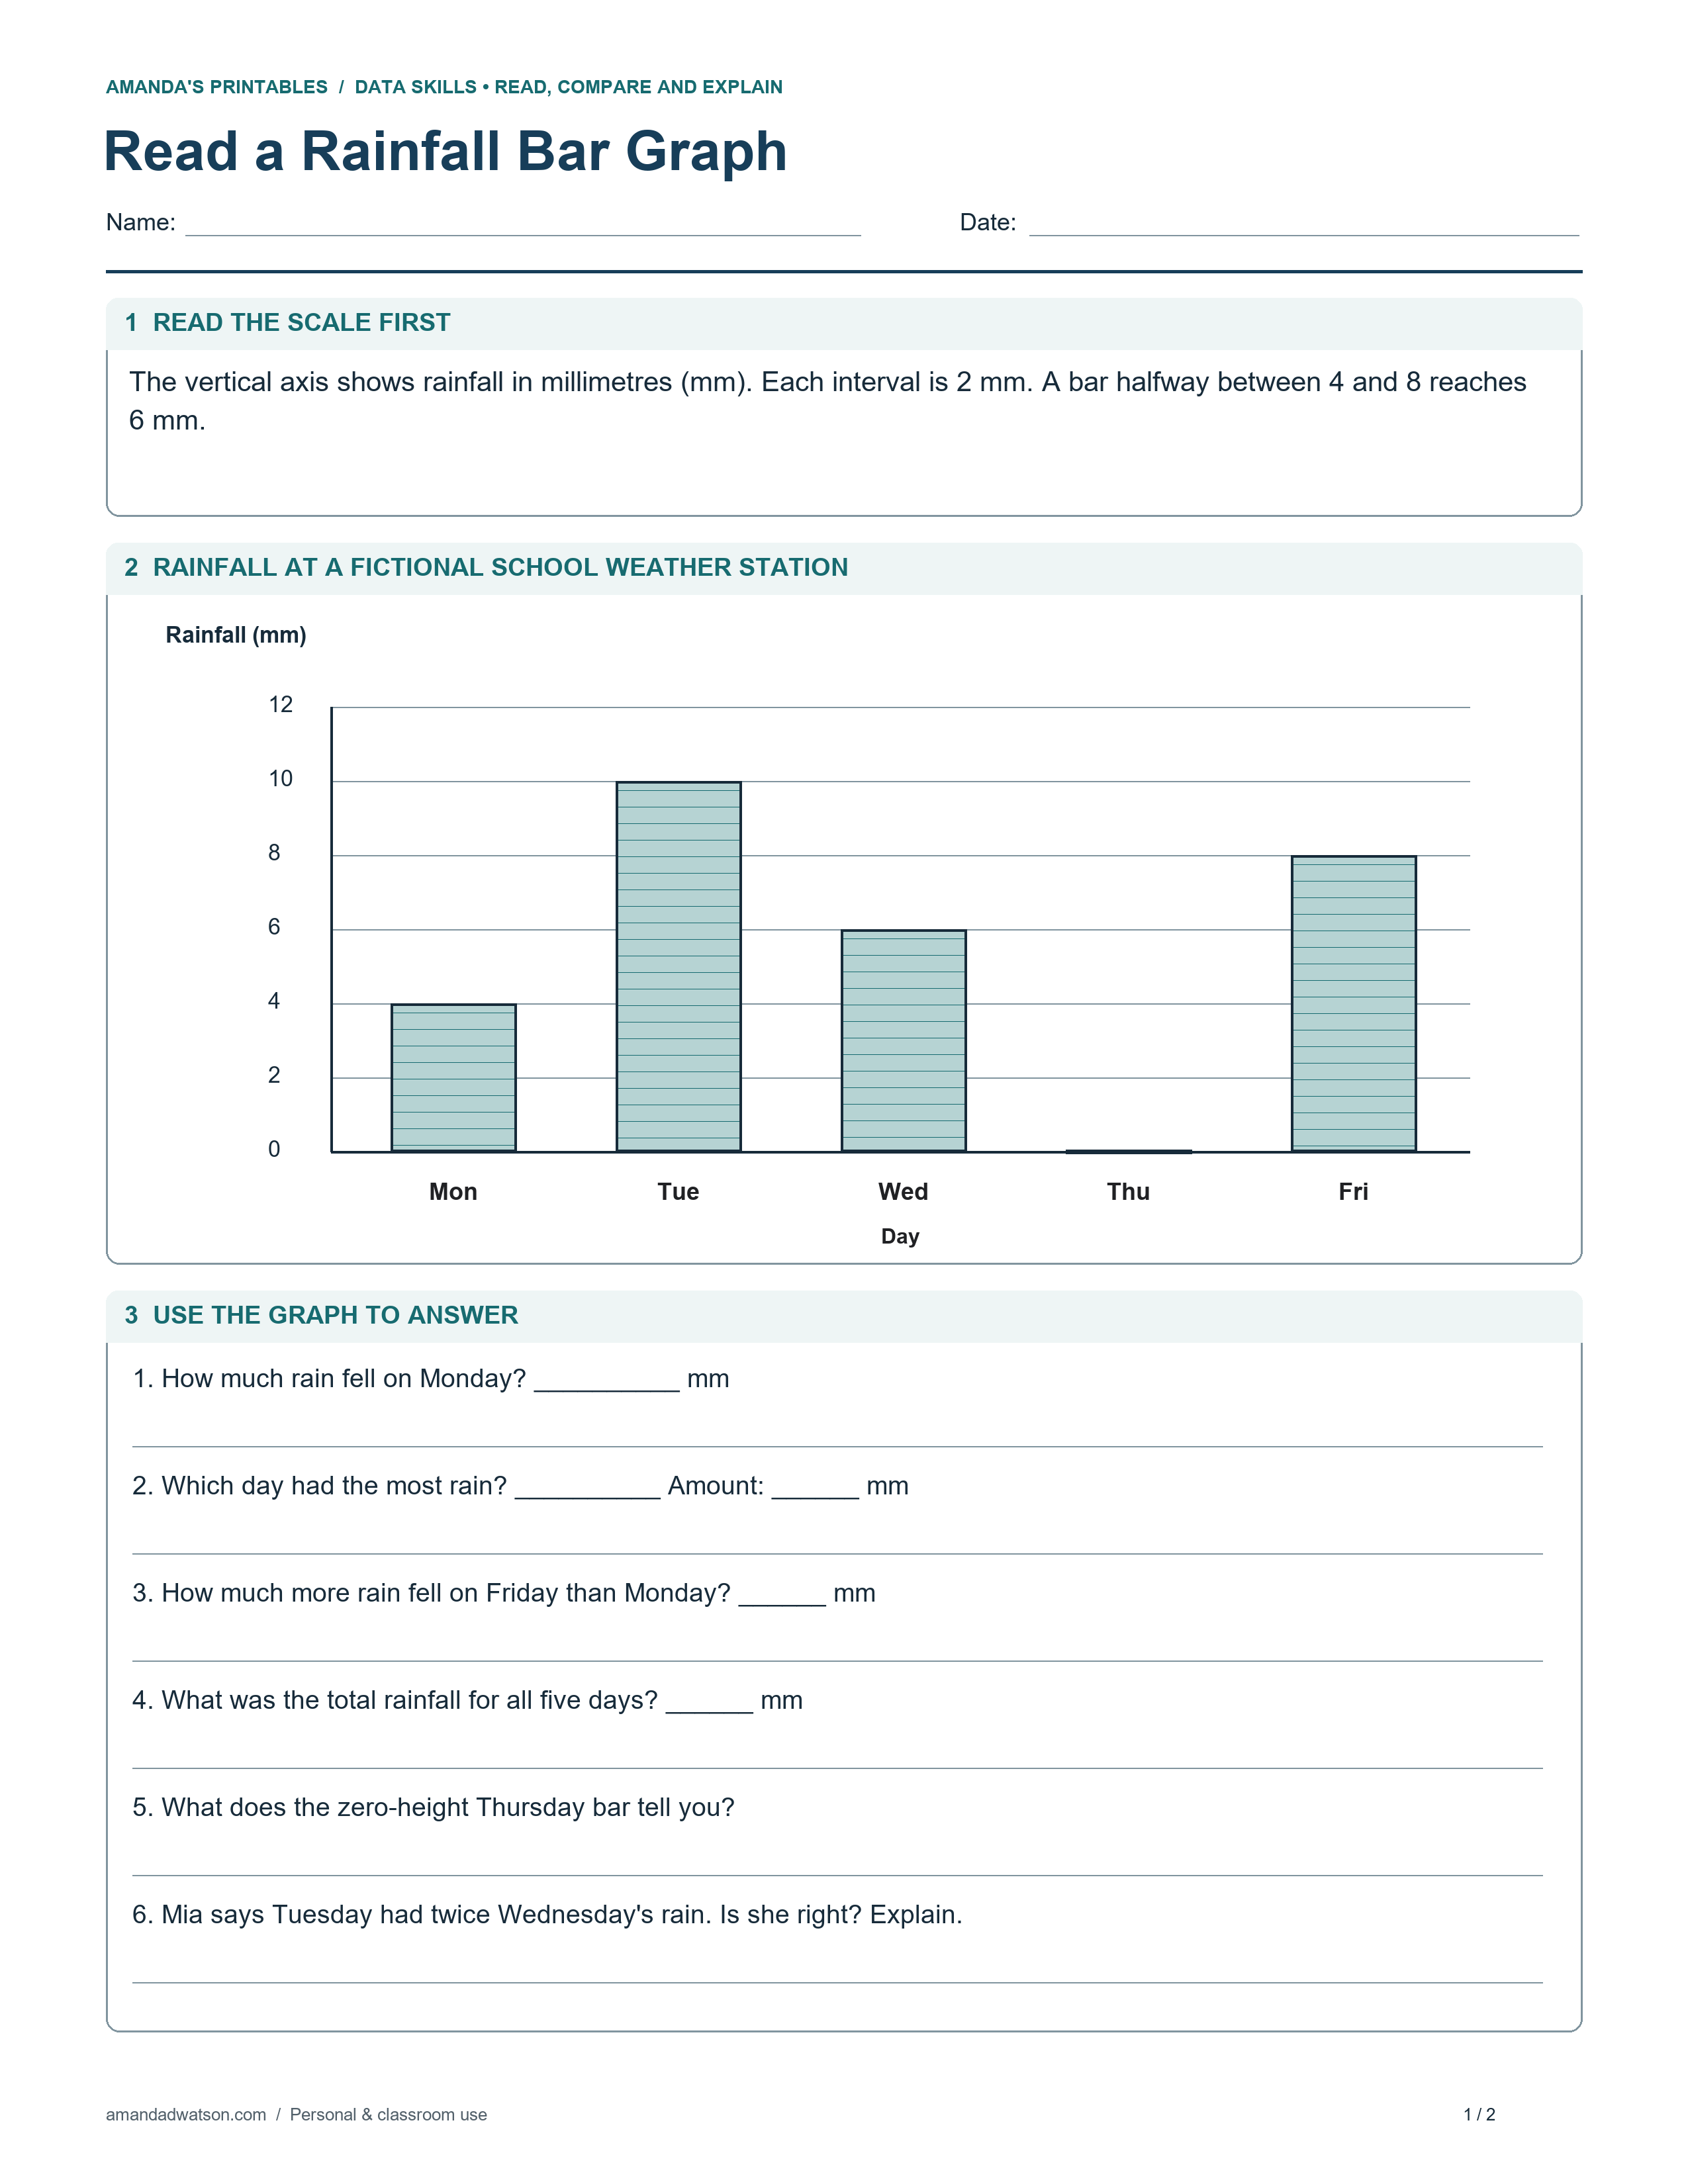
The illustrated chart shows Monday through Friday rainfall with vertical-axis intervals of two millimetres. Six questions progress from reading a single bar to finding a difference and a total. A zero-height bar provides a discussion point, and the final claim asks whether Tuesday’s amount was twice Wednesday’s.
Teach the first example
Before answering, have the learner identify the chart title, the weekday labels and the rainfall unit. Count the vertical-axis labels aloud: zero, two, four and so on. Ask what a bar between four and eight would represent, then let the learner read Monday independently.
Check a worked result
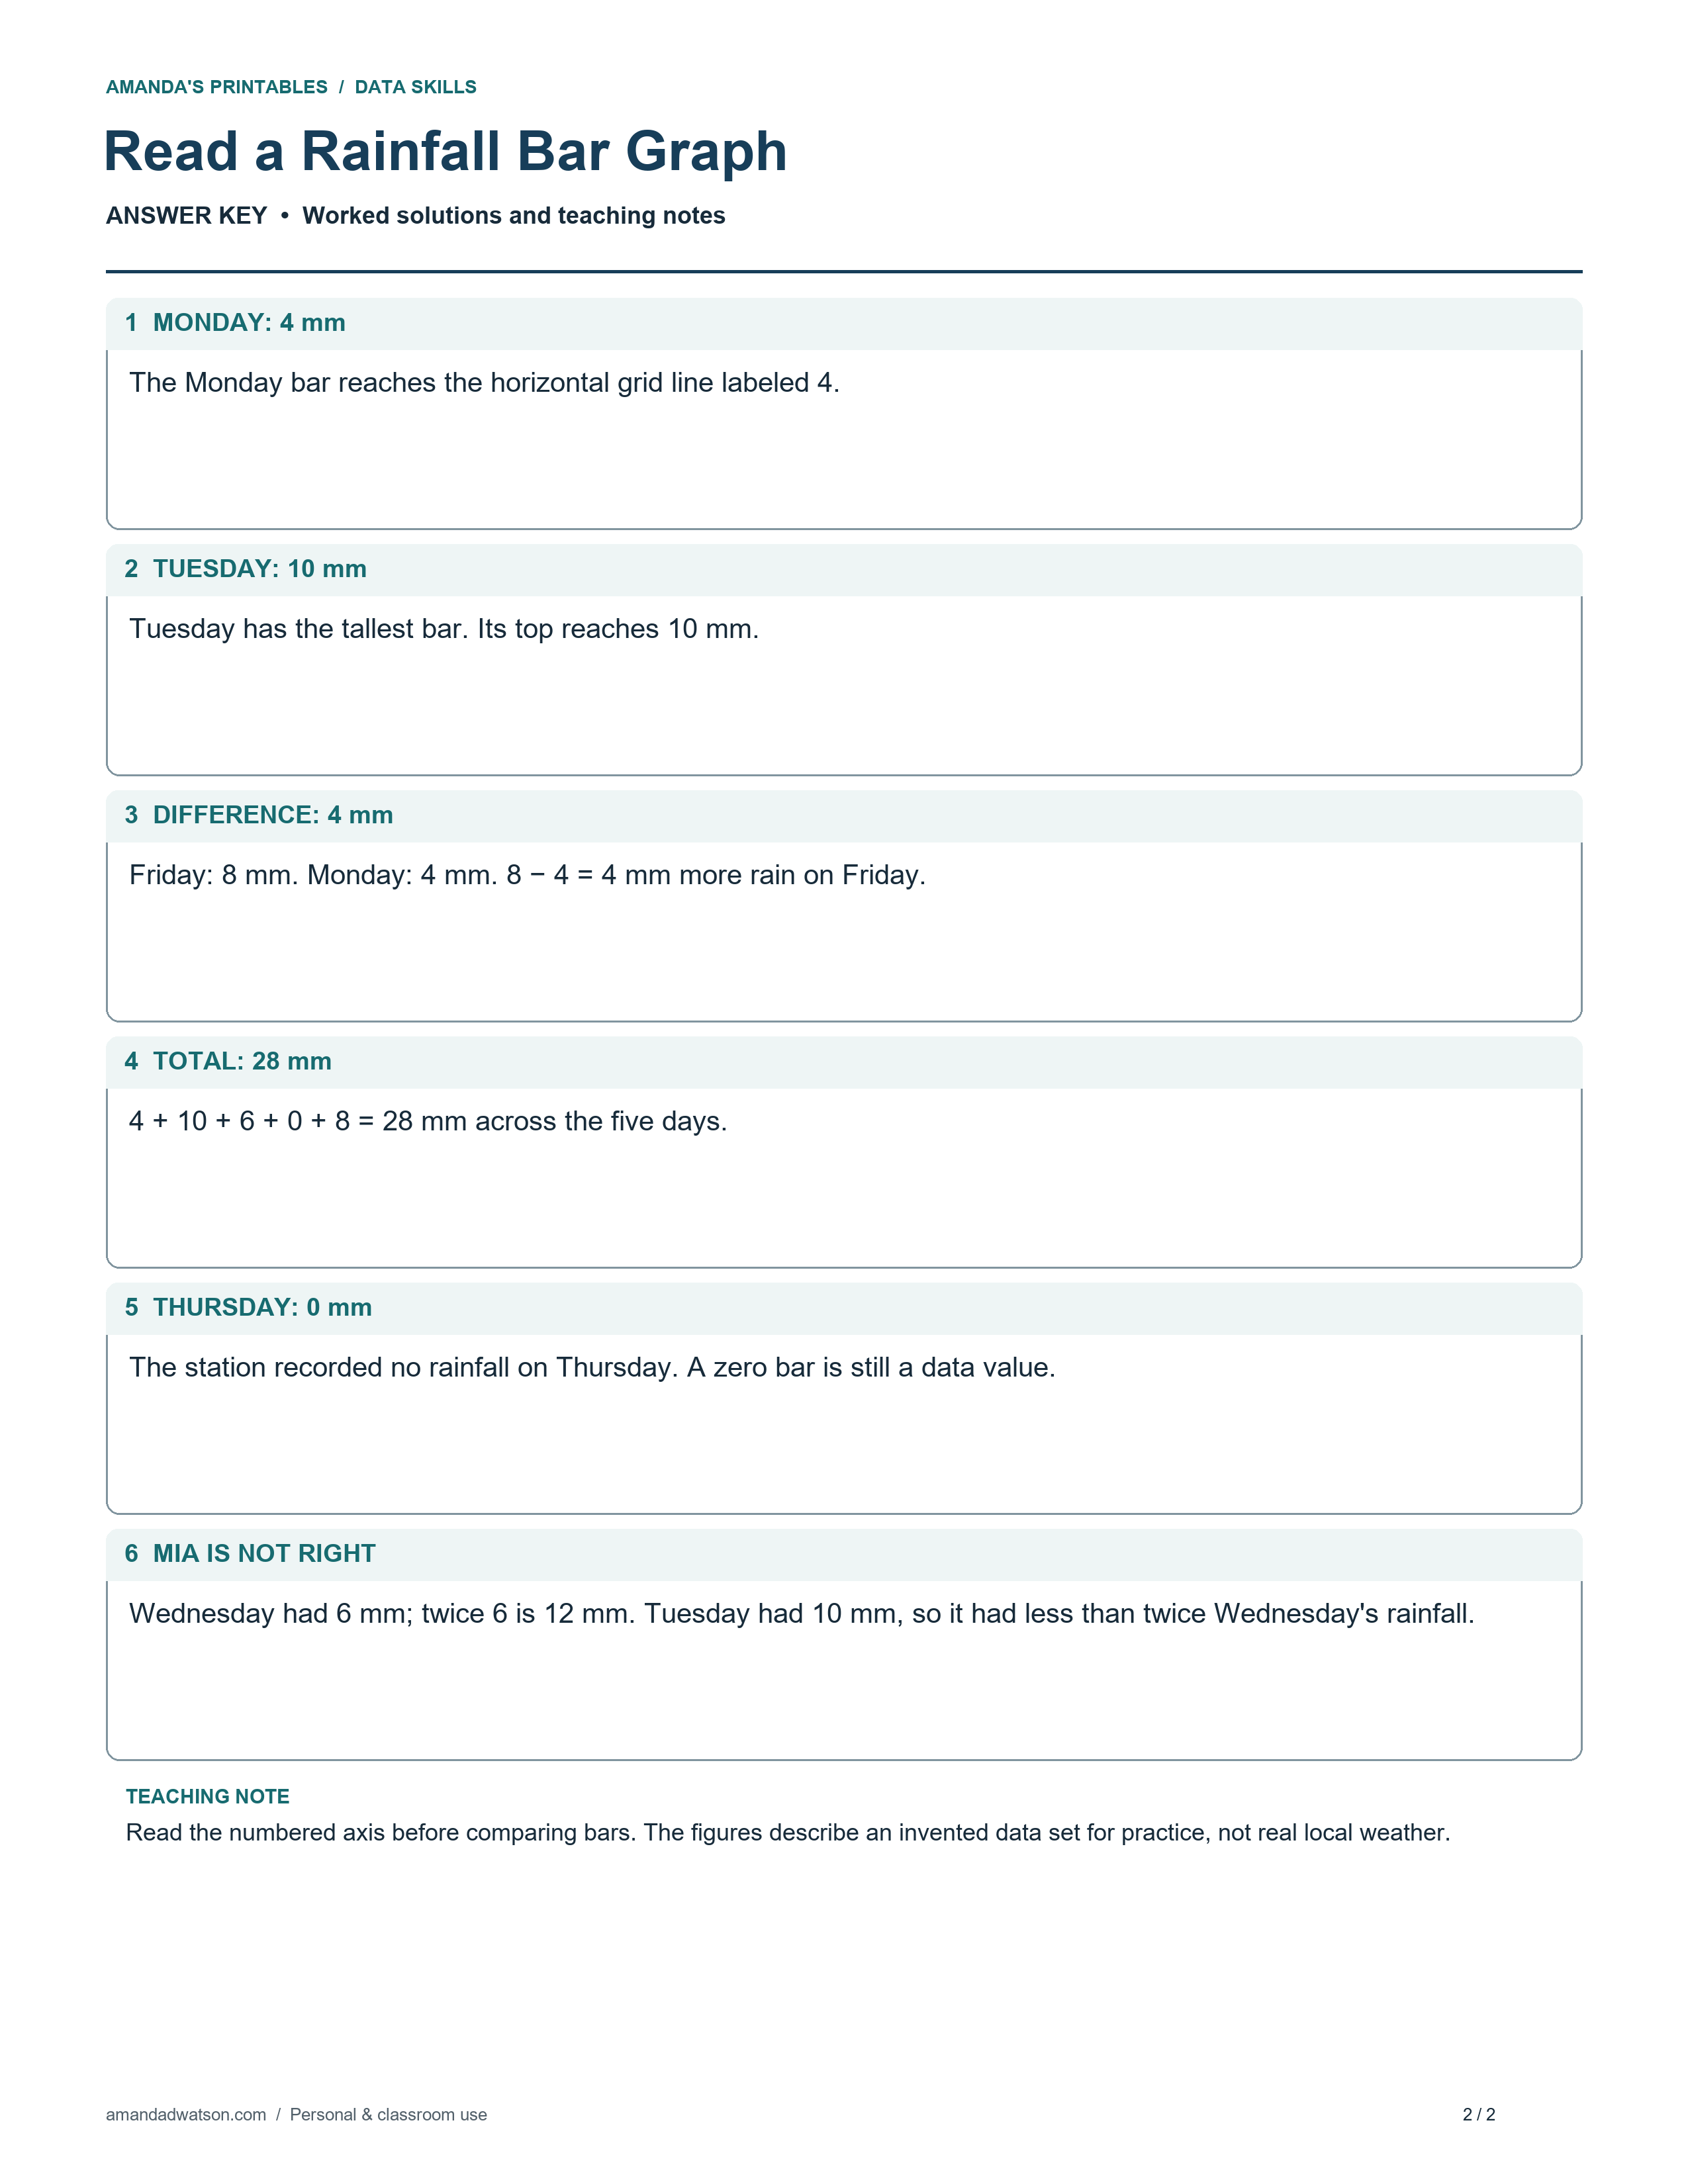
Monday has four millimetres and Friday has eight, so the difference is four millimetres. The five values total twenty-eight. Wednesday has six millimetres; doubling it gives twelve, while Tuesday reaches ten. This makes the final claim false and gives a clear numerical explanation.
Common mistakes to discuss
A frequent mistake is treating each horizontal interval as one unit. Another is reading a zero bar as missing information. Here Thursday’s recorded value is zero millimetres. Encourage learners to name both the number and its unit, and to use actual values when defending or rejecting a comparison.
Worked answer key
Use the second page after an independent attempt. Compare the reasoning as well as the final answer. For explanation questions, equivalent clear wording is acceptable.
Download and print both pages
The bar heights and labeled axis supply all the data. Colour helps separate the bars visually, but the outline, hatching and labels remain readable in grayscale. Fit the page uniformly to Letter or A4 and check the graph axis in print preview. Use Download image beneath each page for its original 2550 × 3300 PNG at 300 dpi. Choose US Letter or A4 and Download PDF for that page. Download the student sheet and answer key separately. These are flat printables for handwriting, not interactive forms. Original pages are for personal and classroom use; share this article link when recommending them.