
Music Practice Bar Graph Worksheet gives learners a diagram, one worked example and five questions. The student sheet leaves space to show work. A second printable page gives the steps for each answer.
Start with the model
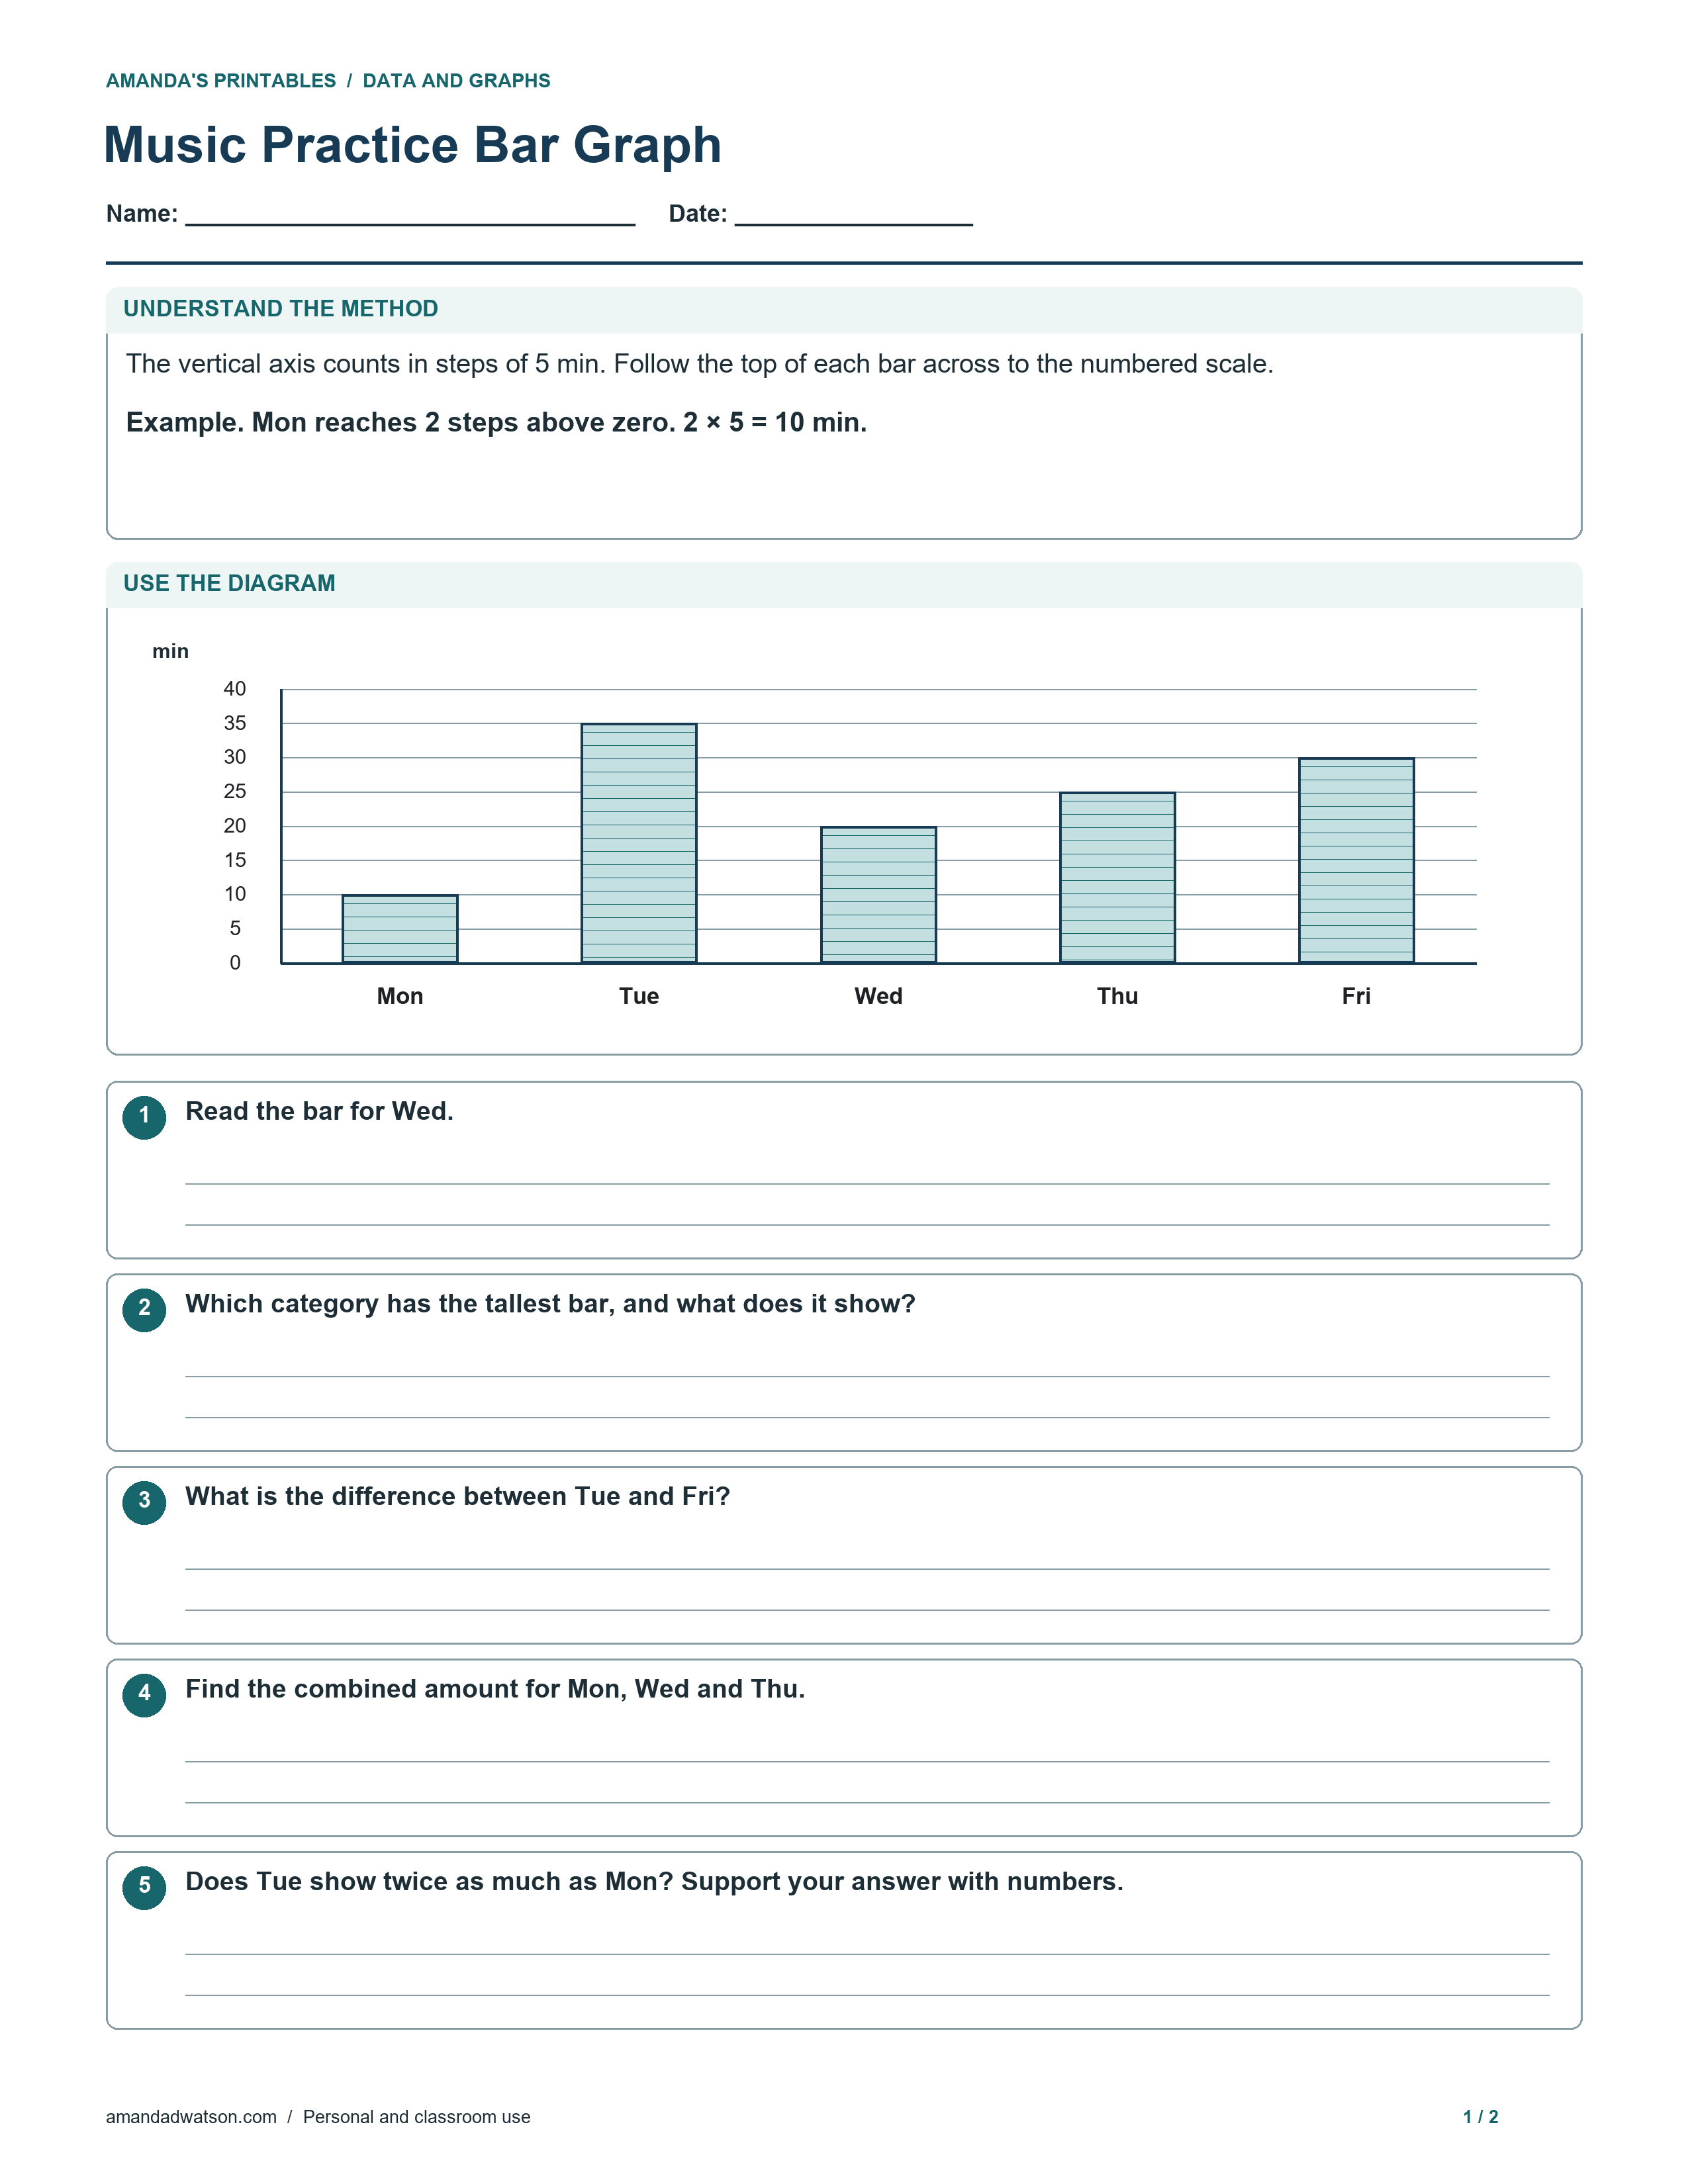
The vertical axis counts in steps of 5 min. Follow the top of each bar across to the numbered scale.
Practice data: Mon 10 min, Tue 35 min, Wed 20 min, Thu 25 min, Fri 30 min.
Worked example
Mon reaches 2 steps above zero. 2 × 5 = 10 min.
Ask the learner to point to the information used in the example. When they move on to the exercises, have them record the quantity, unit or label that each step represents.
Practice questions
- Read the bar for Wed.
- Which category has the tallest bar, and what does it show?
- What is the difference between Tue and Fri?
- Find the combined amount for Mon, Wed and Thu.
- Does Tue show twice as much as Mon? Support your answer with numbers.
Separate answer key
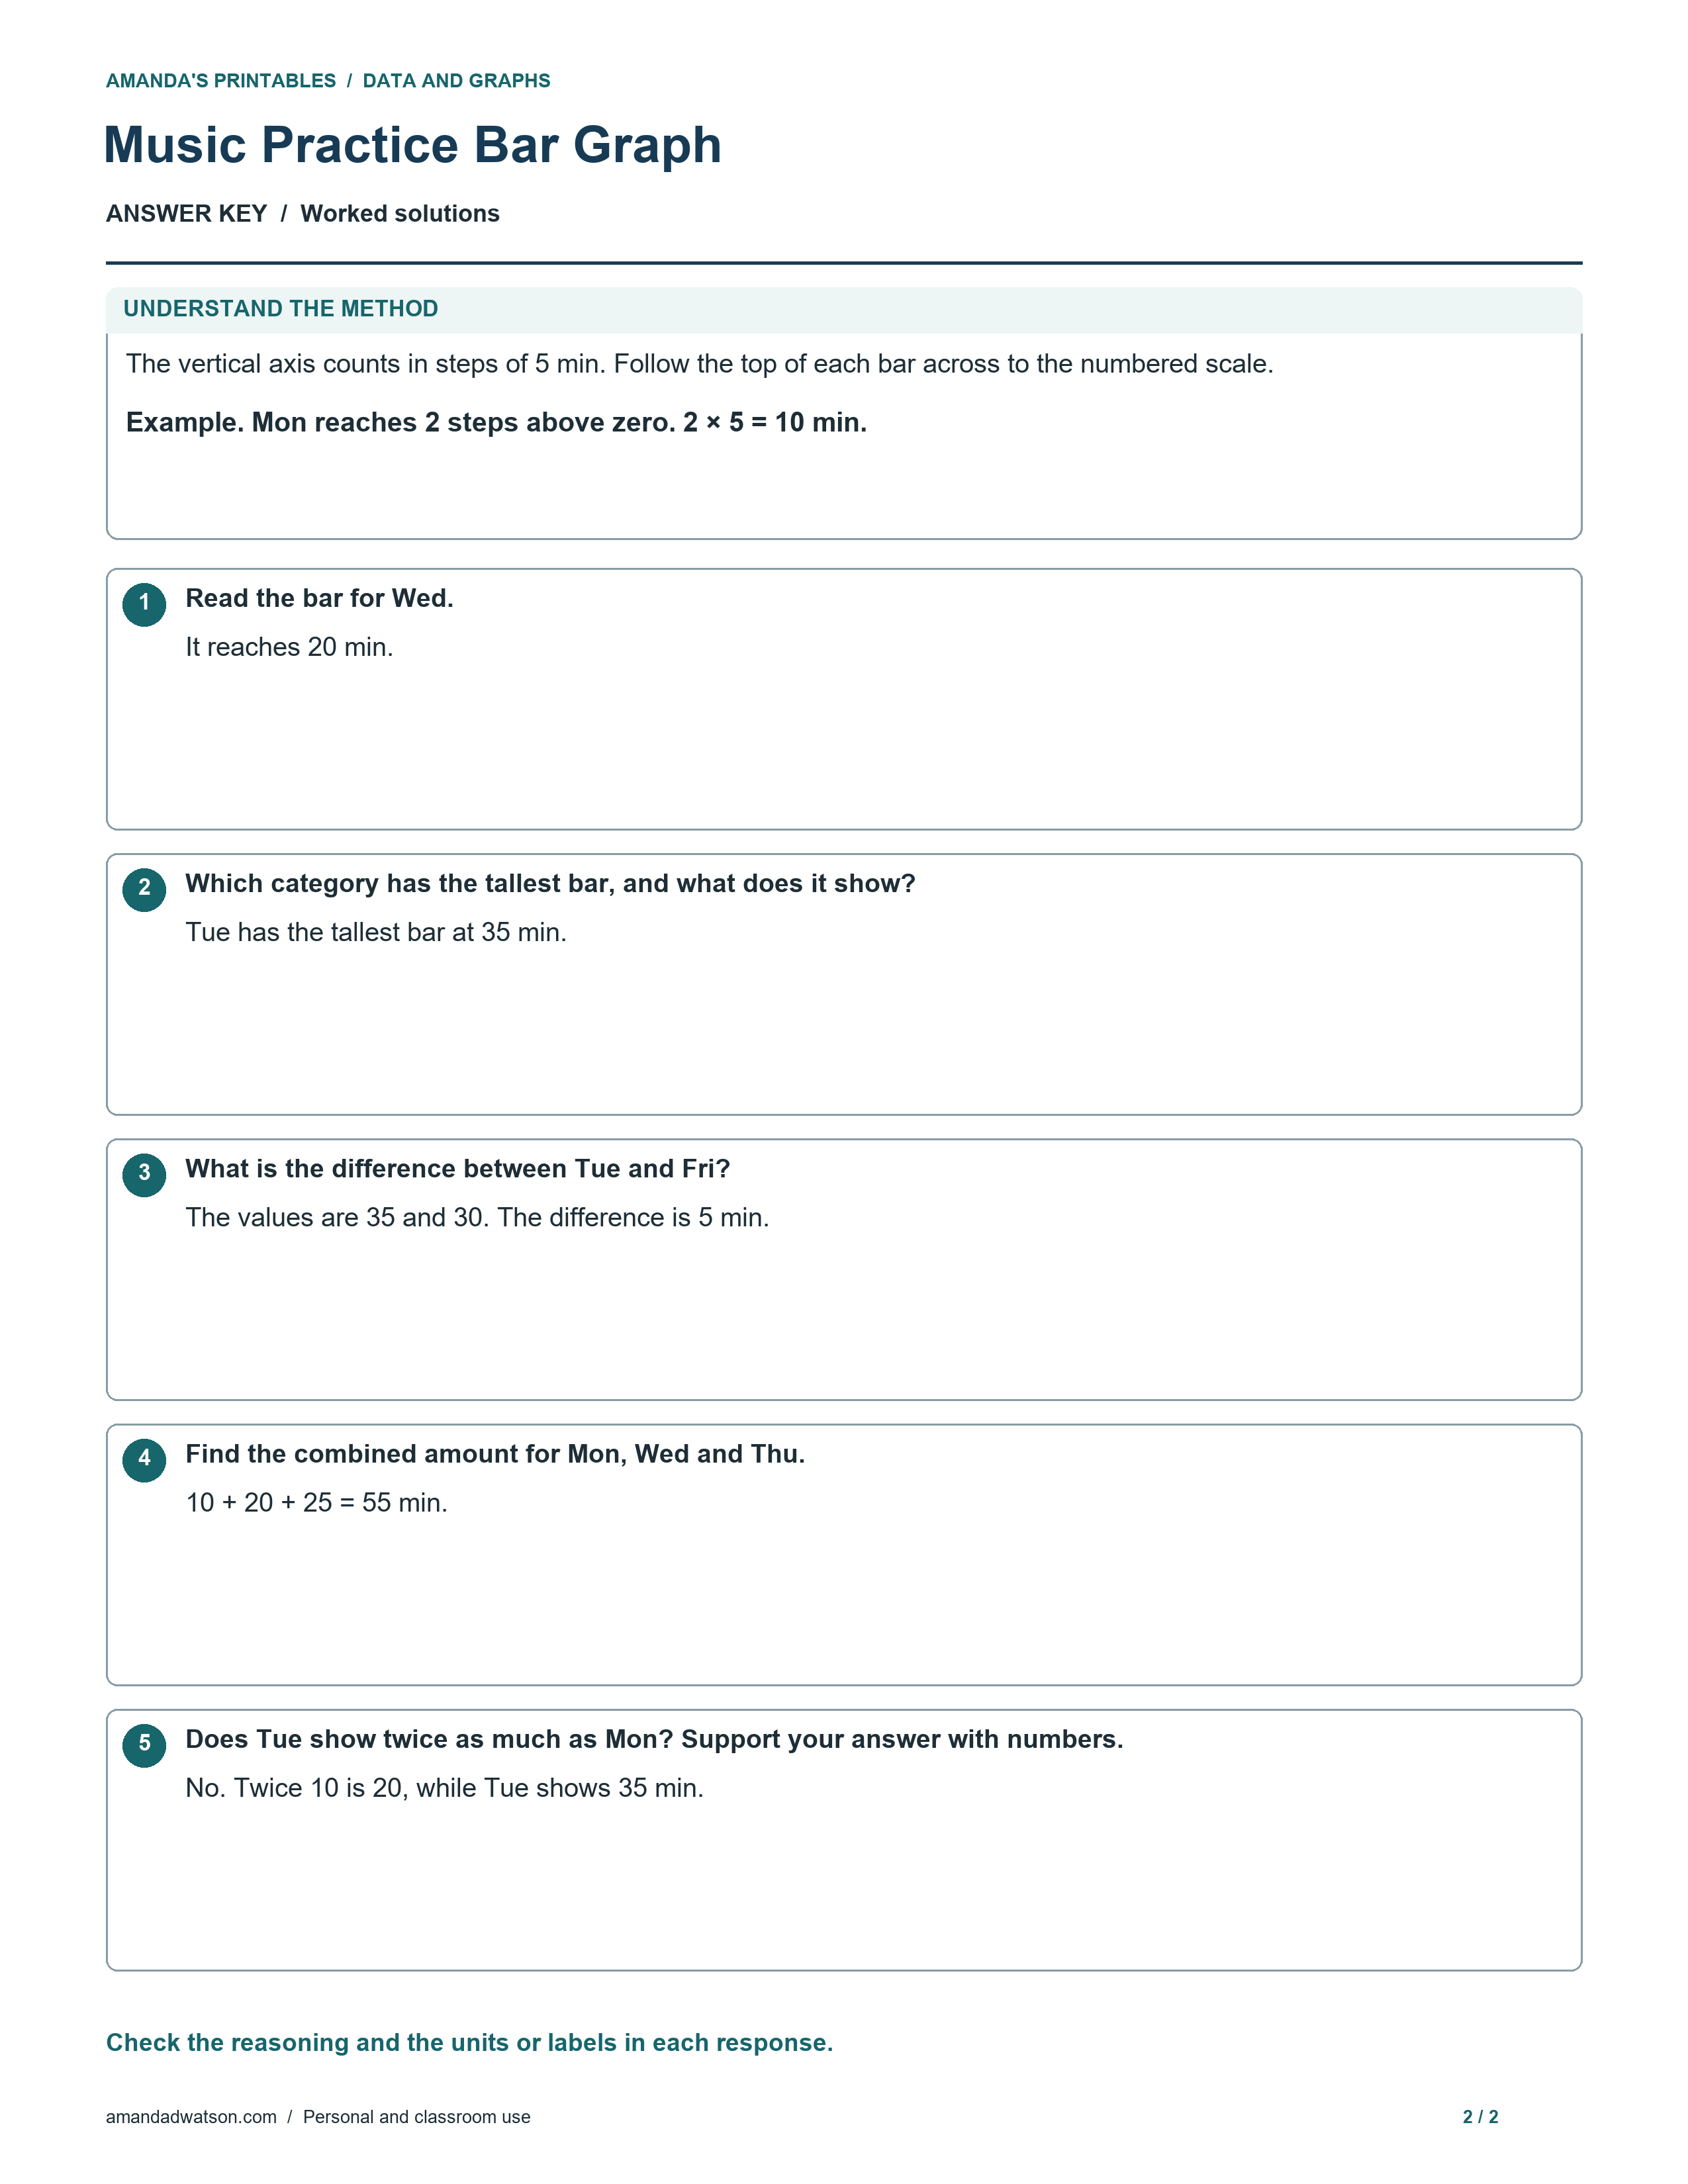
- It reaches 20 min.
- Tue has the tallest bar at 35 min.
- The values are 35 and 30. The difference is 5 min.
- 10 + 20 + 25 = 55 min.
- No. Twice 10 is 20, while Tue shows 35 min.
Download the student sheet and key
Each page has its own Download image and Download PDF controls. Choose US Letter or A4 for the PDF. Match the paper size in the print dialog and check the page edges before printing. The original PNGs are 2550 × 3300 pixels at 300 dpi. The pages are free for personal and classroom use.