
Art Kits Assembled Line Graph Worksheet gives learners a diagram, one worked example and five questions. The student sheet leaves space to show work. A second printable page gives the steps for each answer.
Start with the model
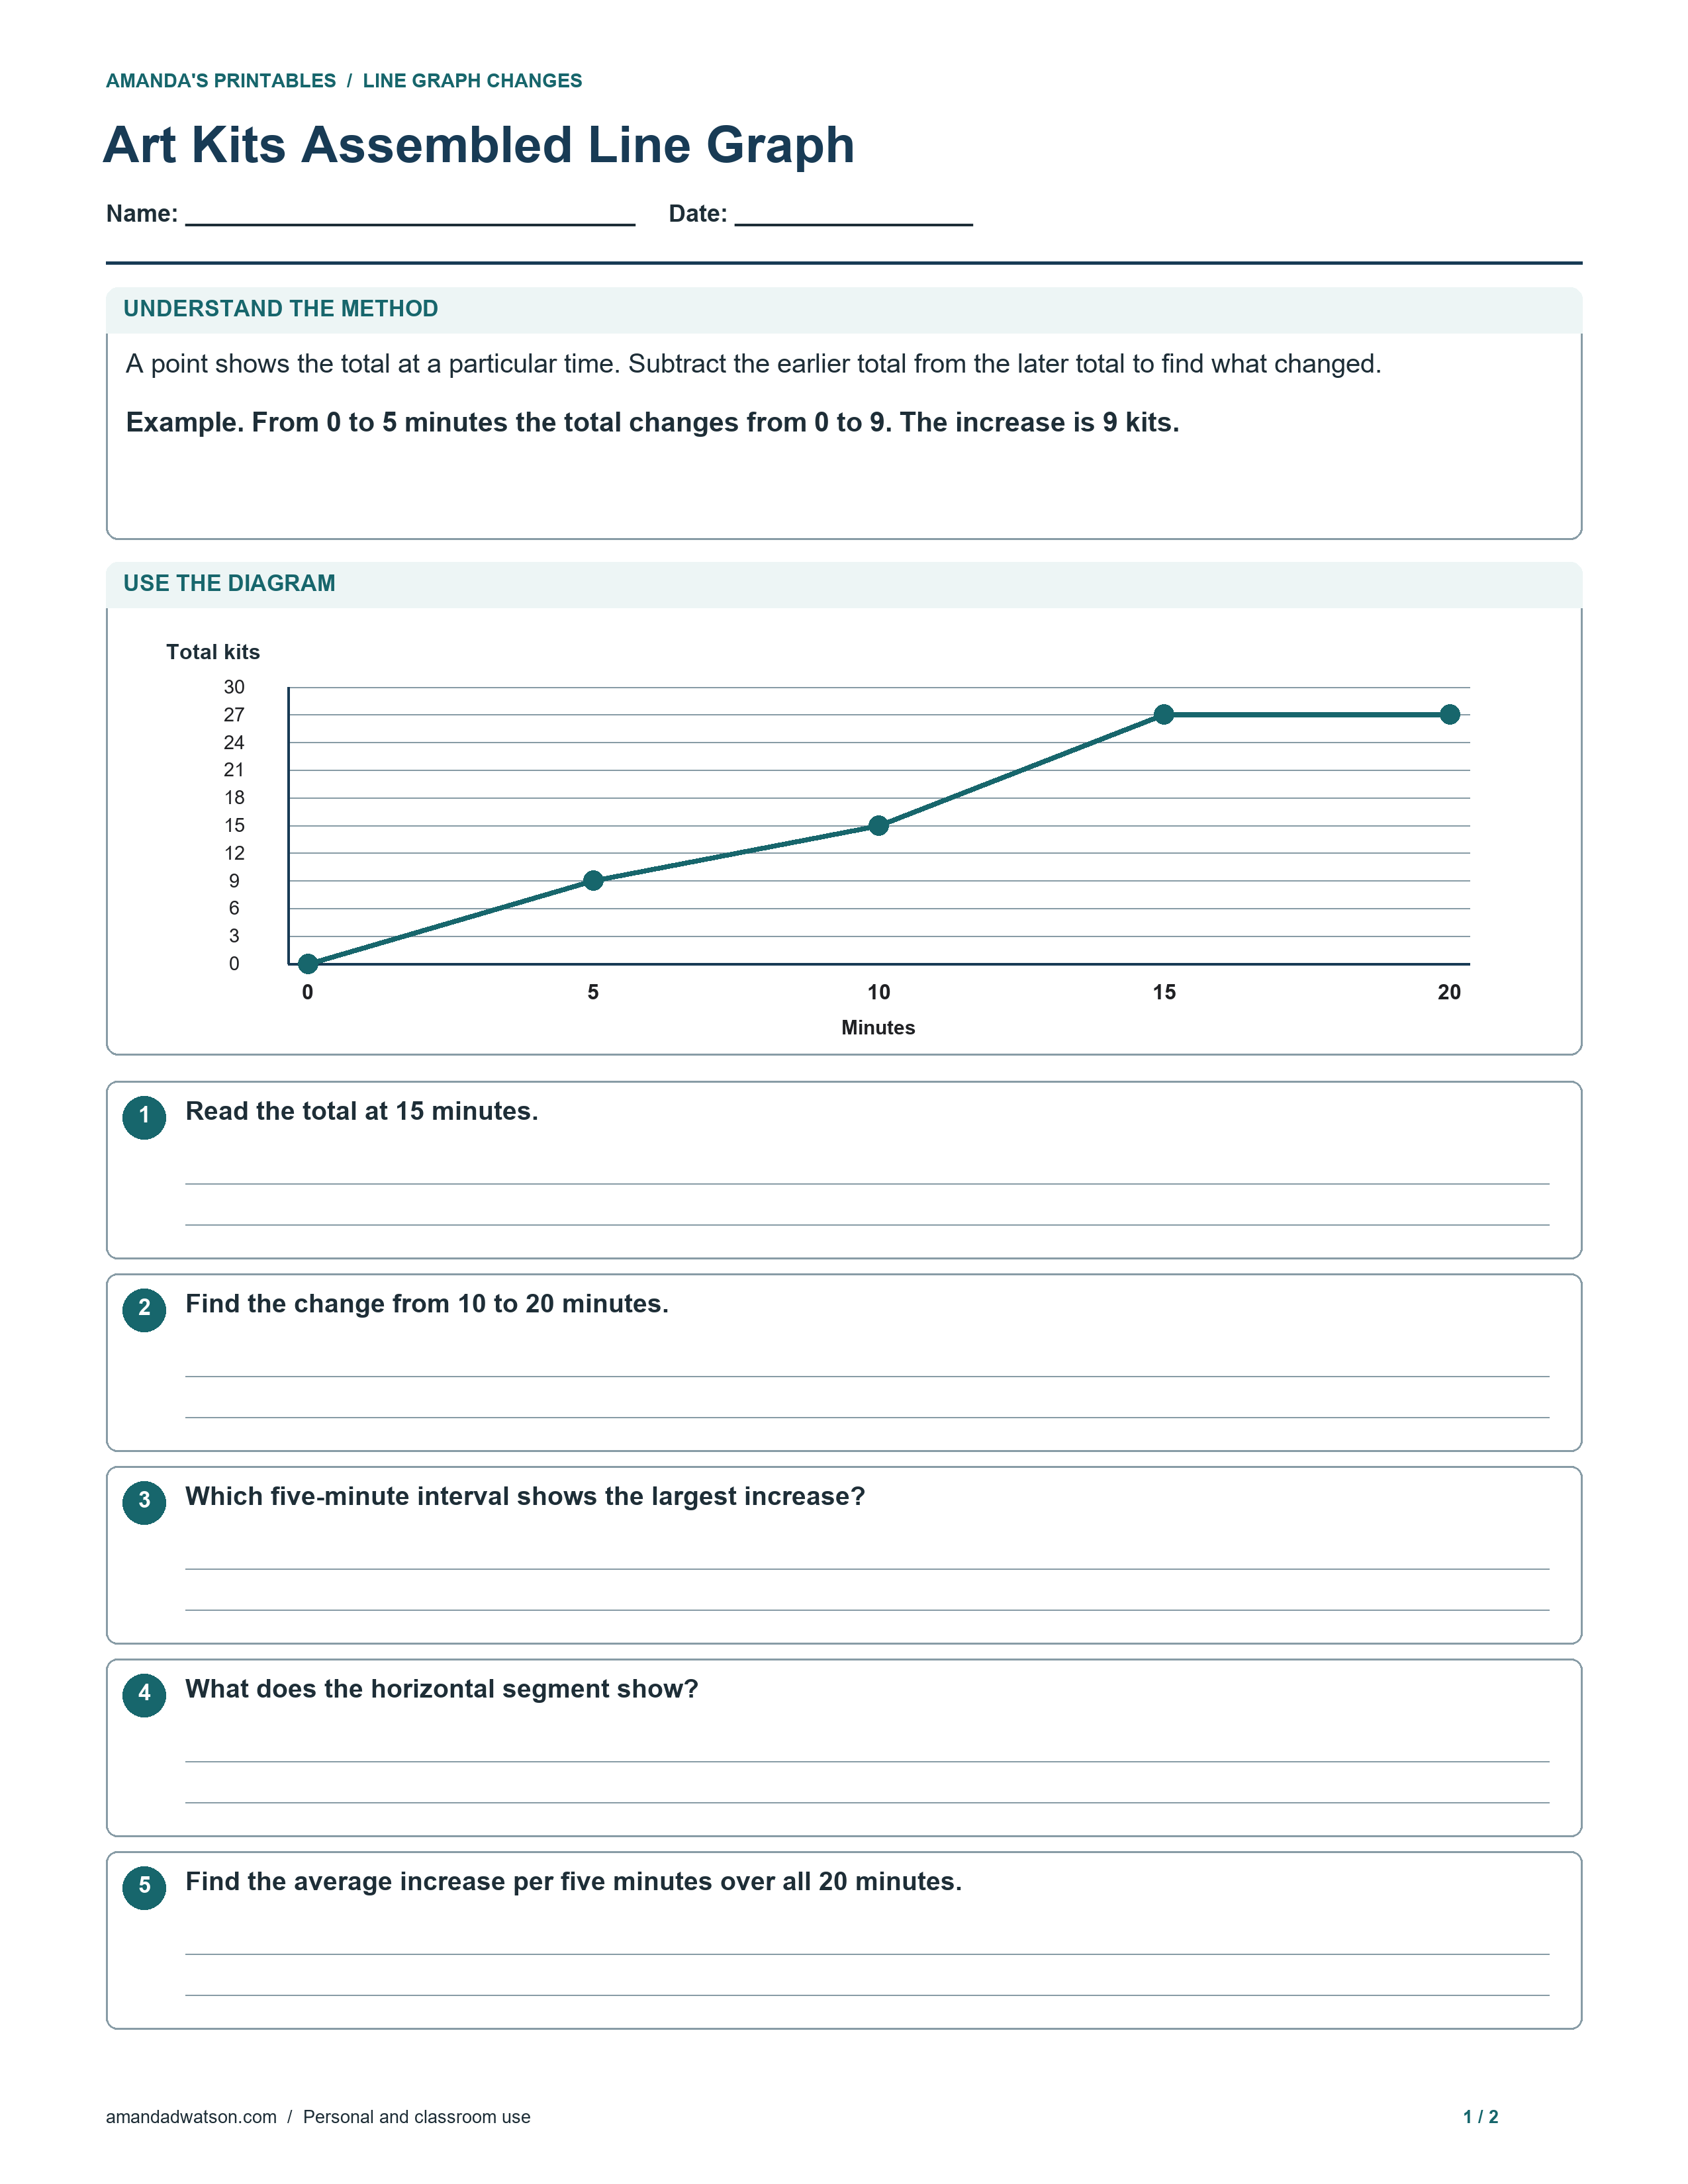
A point shows the total at a particular time. Subtract the earlier total from the later total to find what changed.
Practice data at 0, 5, 10, 15 and 20 minutes: 0, 9, 15, 27, 27 kits, respectively.
Worked example
From 0 to 5 minutes the total changes from 0 to 9. The increase is 9 kits.
Ask the learner to point to the information used in the example. When they move on to the exercises, have them record the quantity, unit or label that each step represents.
Practice questions
- Read the total at 15 minutes.
- Find the change from 10 to 20 minutes.
- Which five-minute interval shows the largest increase?
- What does the horizontal segment show?
- Find the average increase per five minutes over all 20 minutes.
Separate answer key
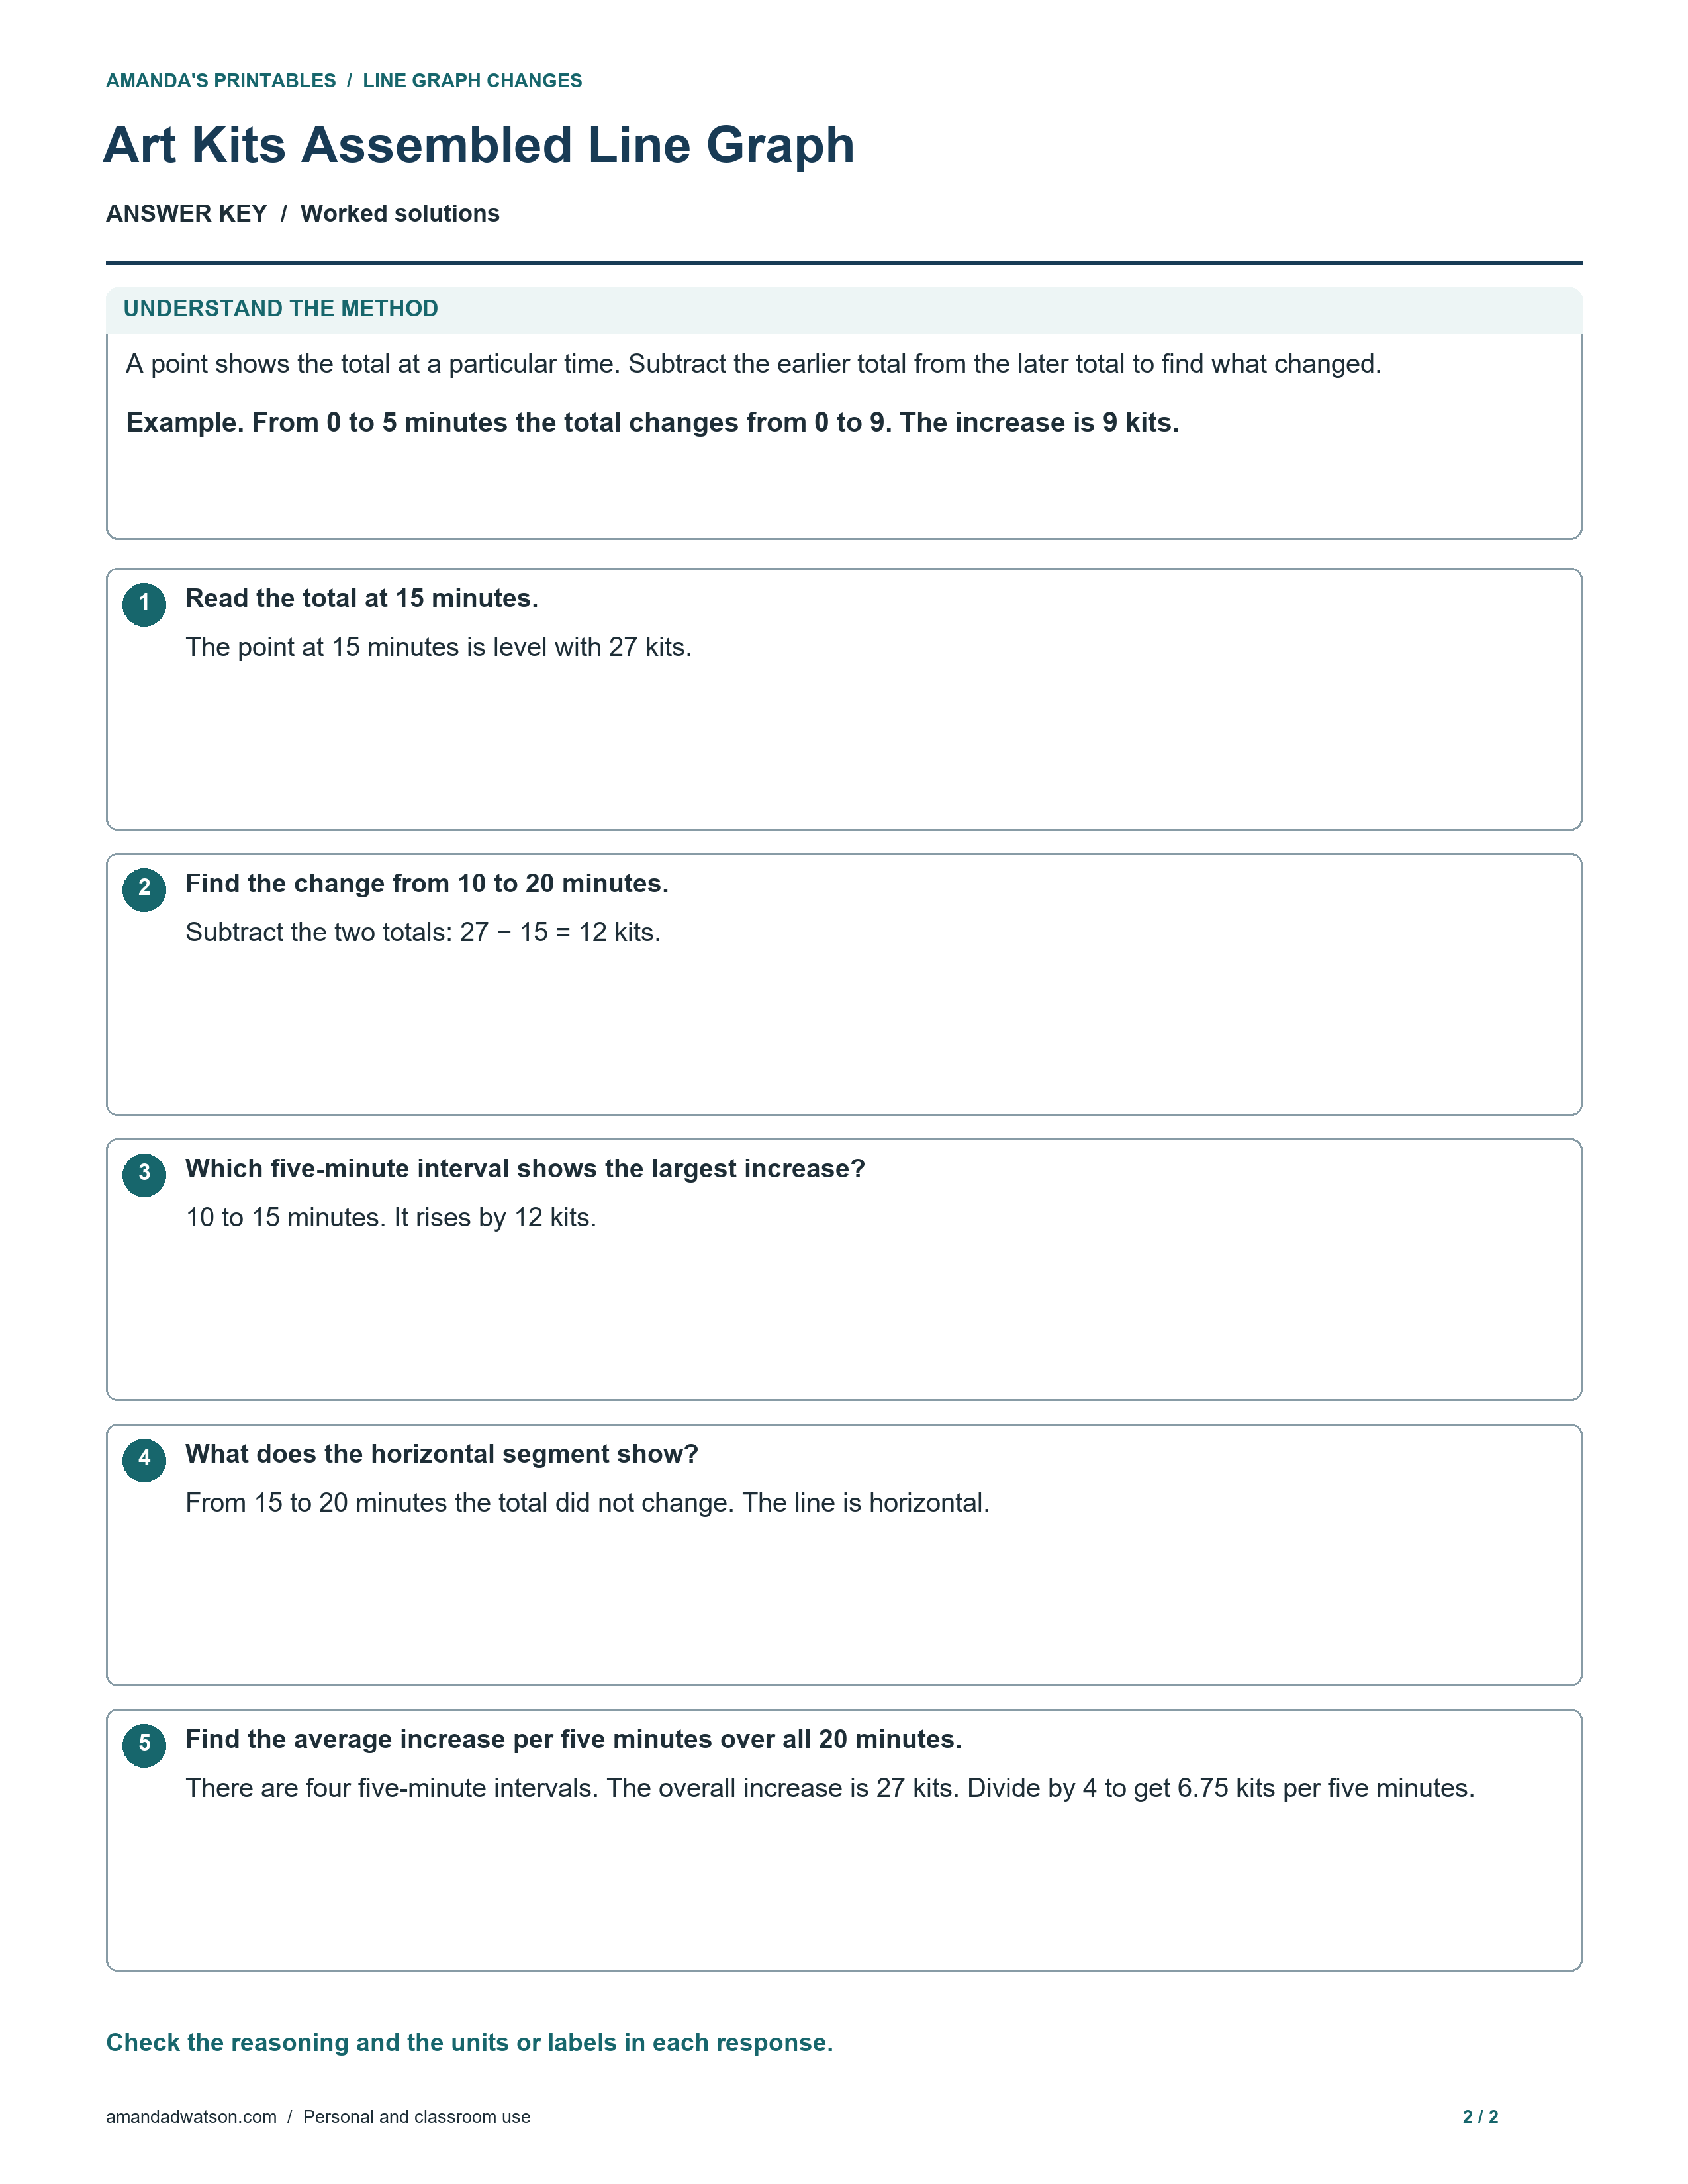
- The point at 15 minutes is level with 27 kits.
- Subtract the two totals: 27 − 15 = 12 kits.
- 10 to 15 minutes. It rises by 12 kits.
- From 15 to 20 minutes the total did not change. The line is horizontal.
- There are four five-minute intervals. The overall increase is 27 kits. Divide by 4 to get 6.75 kits per five minutes.
Download the student sheet and key
Each page has its own Download image and Download PDF controls. Choose US Letter or A4 for the PDF. Match the paper size in the print dialog and check the page edges before printing. The original PNGs are 2550 × 3300 pixels at 300 dpi. The pages are free for personal and classroom use.