
Printable Workshop Practice Rounds Dot Plot Worksheet gives learners a diagram, one worked example and five questions. The student sheet leaves space to show work. A second printable page gives the steps for each answer.
Start with the model
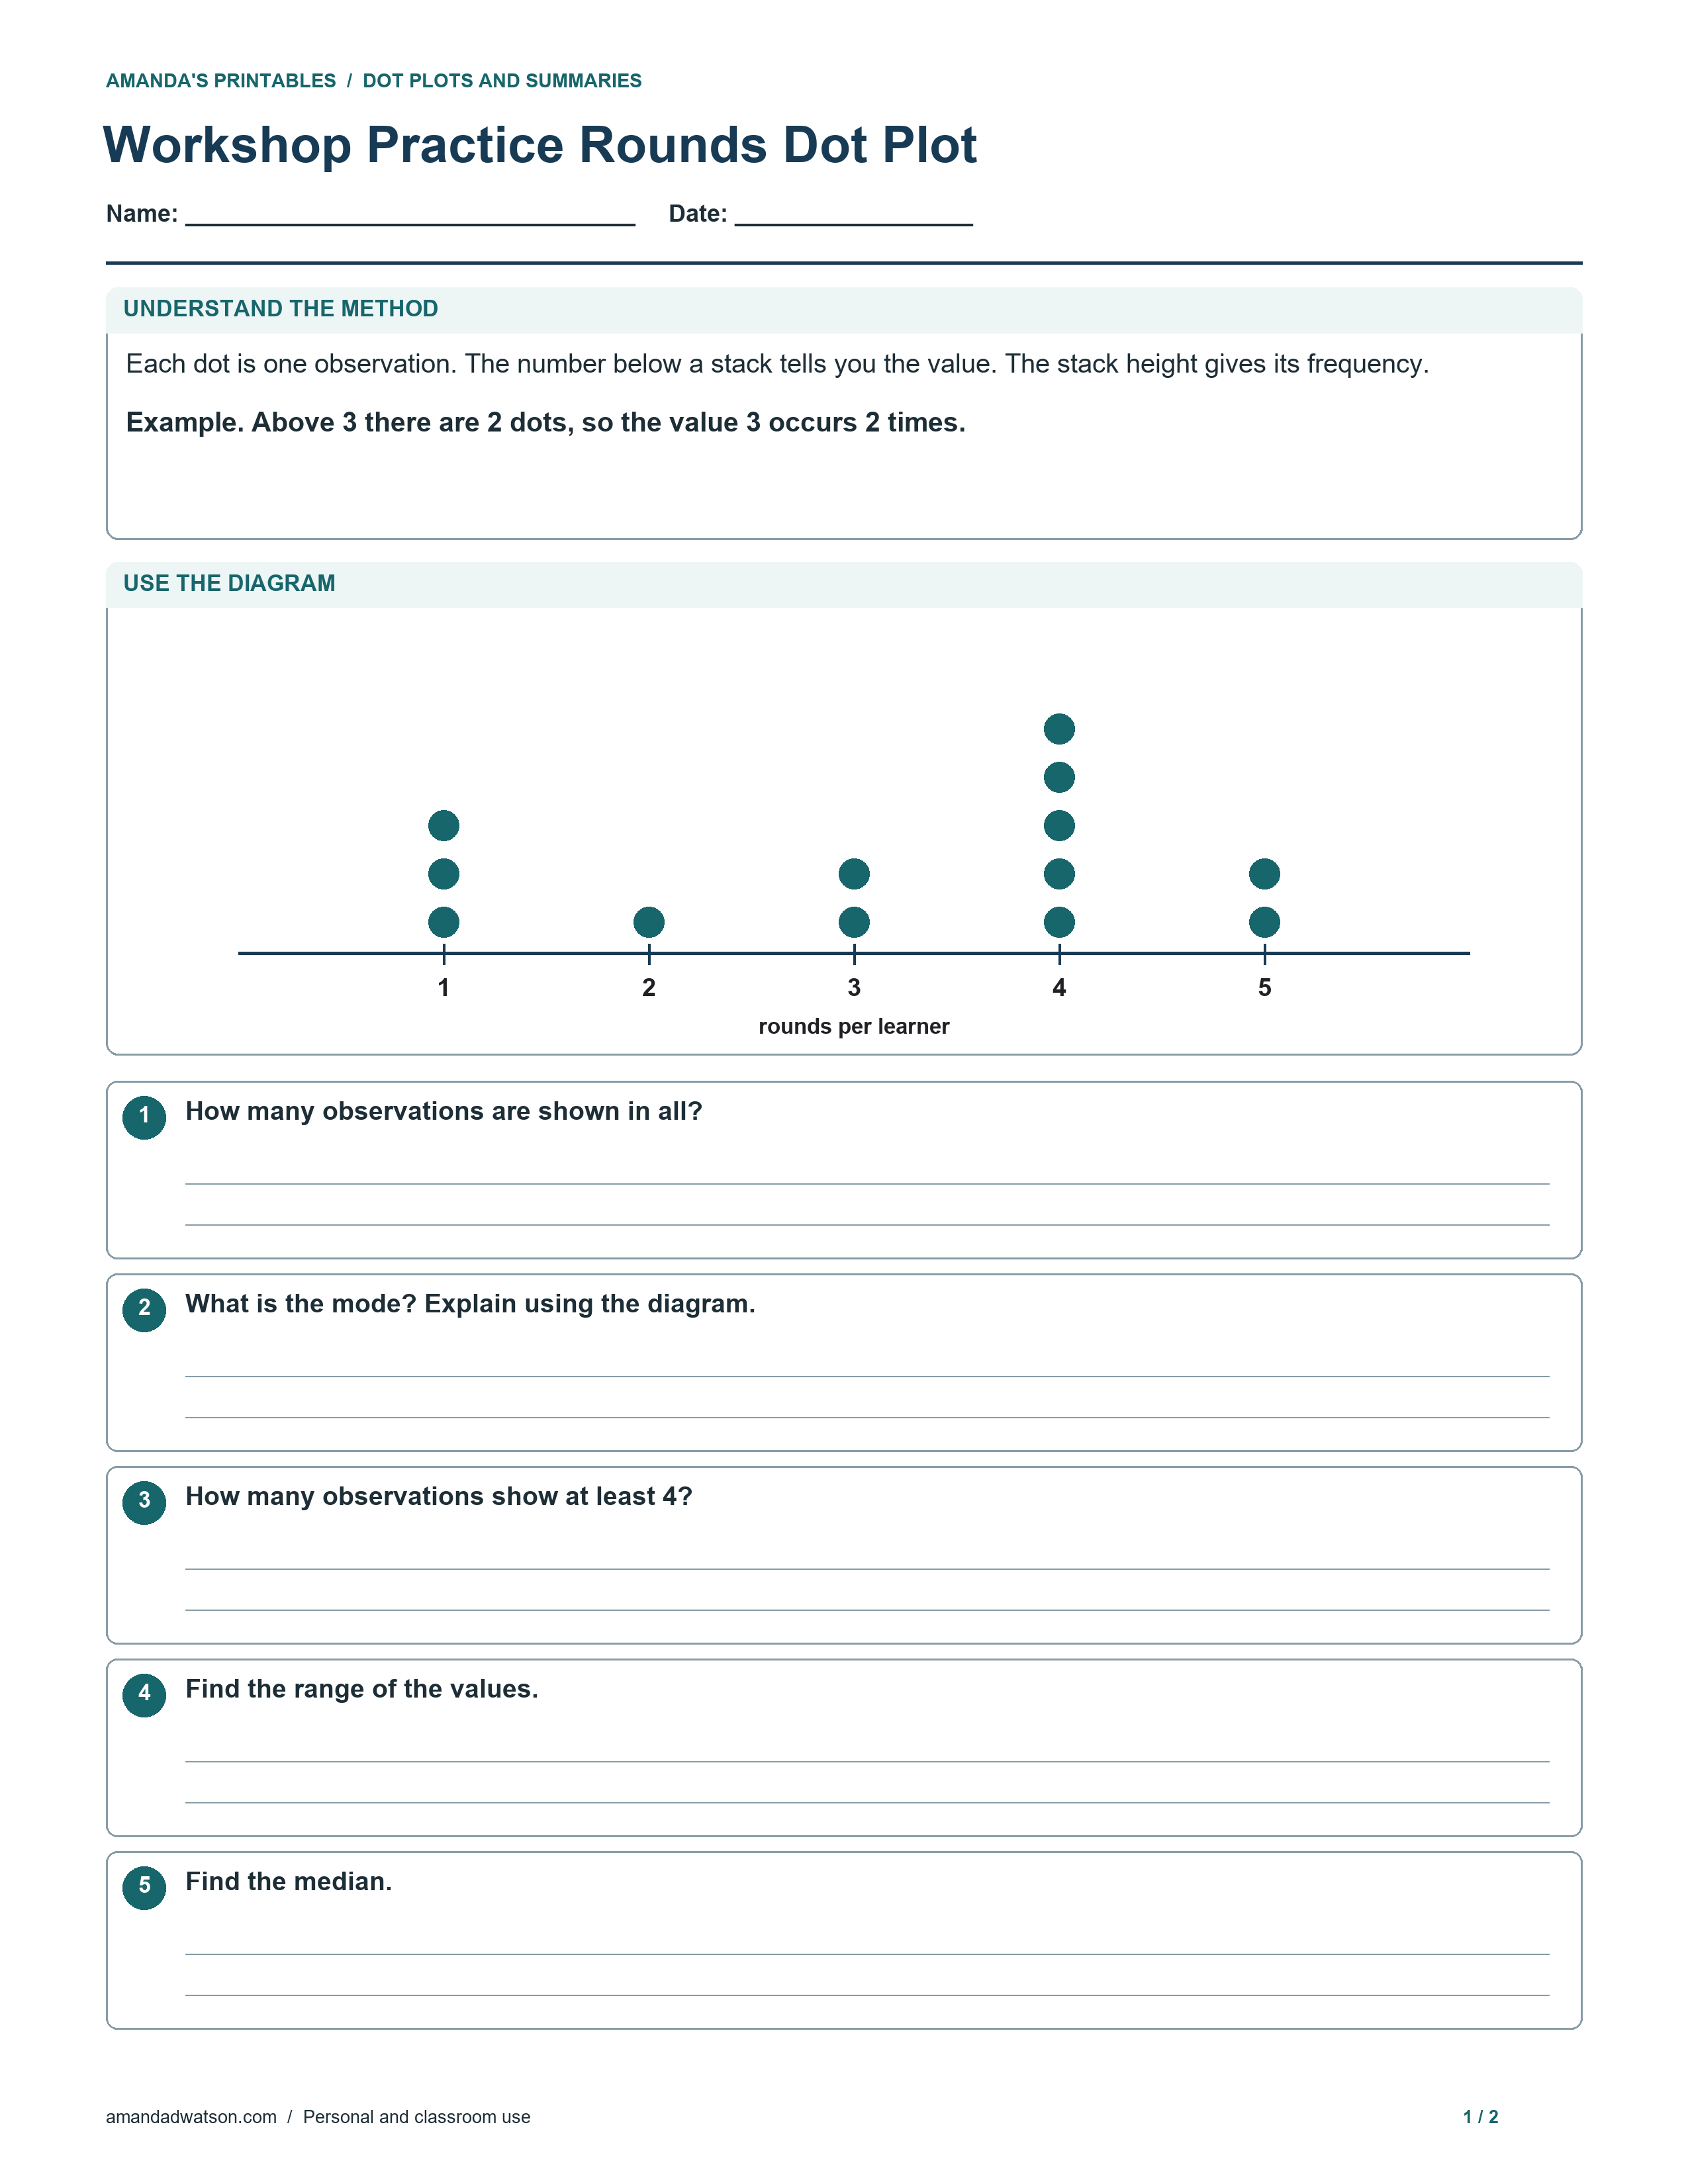
Each dot is one observation. The number below a stack tells you the value. The stack height gives its frequency.
The horizontal axis represents rounds per learner. Frequencies for values 1 through 5 are 3, 1, 2, 5, 2.
Worked example
Above 3 there are 2 dots, so the value 3 occurs 2 times.
Ask the learner to point to the information used in the example. When they move on to the exercises, have them record the quantity, unit or label that each step represents.
Practice questions
- How many observations are shown in all?
- What is the mode? Explain using the diagram.
- How many observations show at least 4?
- Find the range of the values.
- Find the median.
Separate answer key
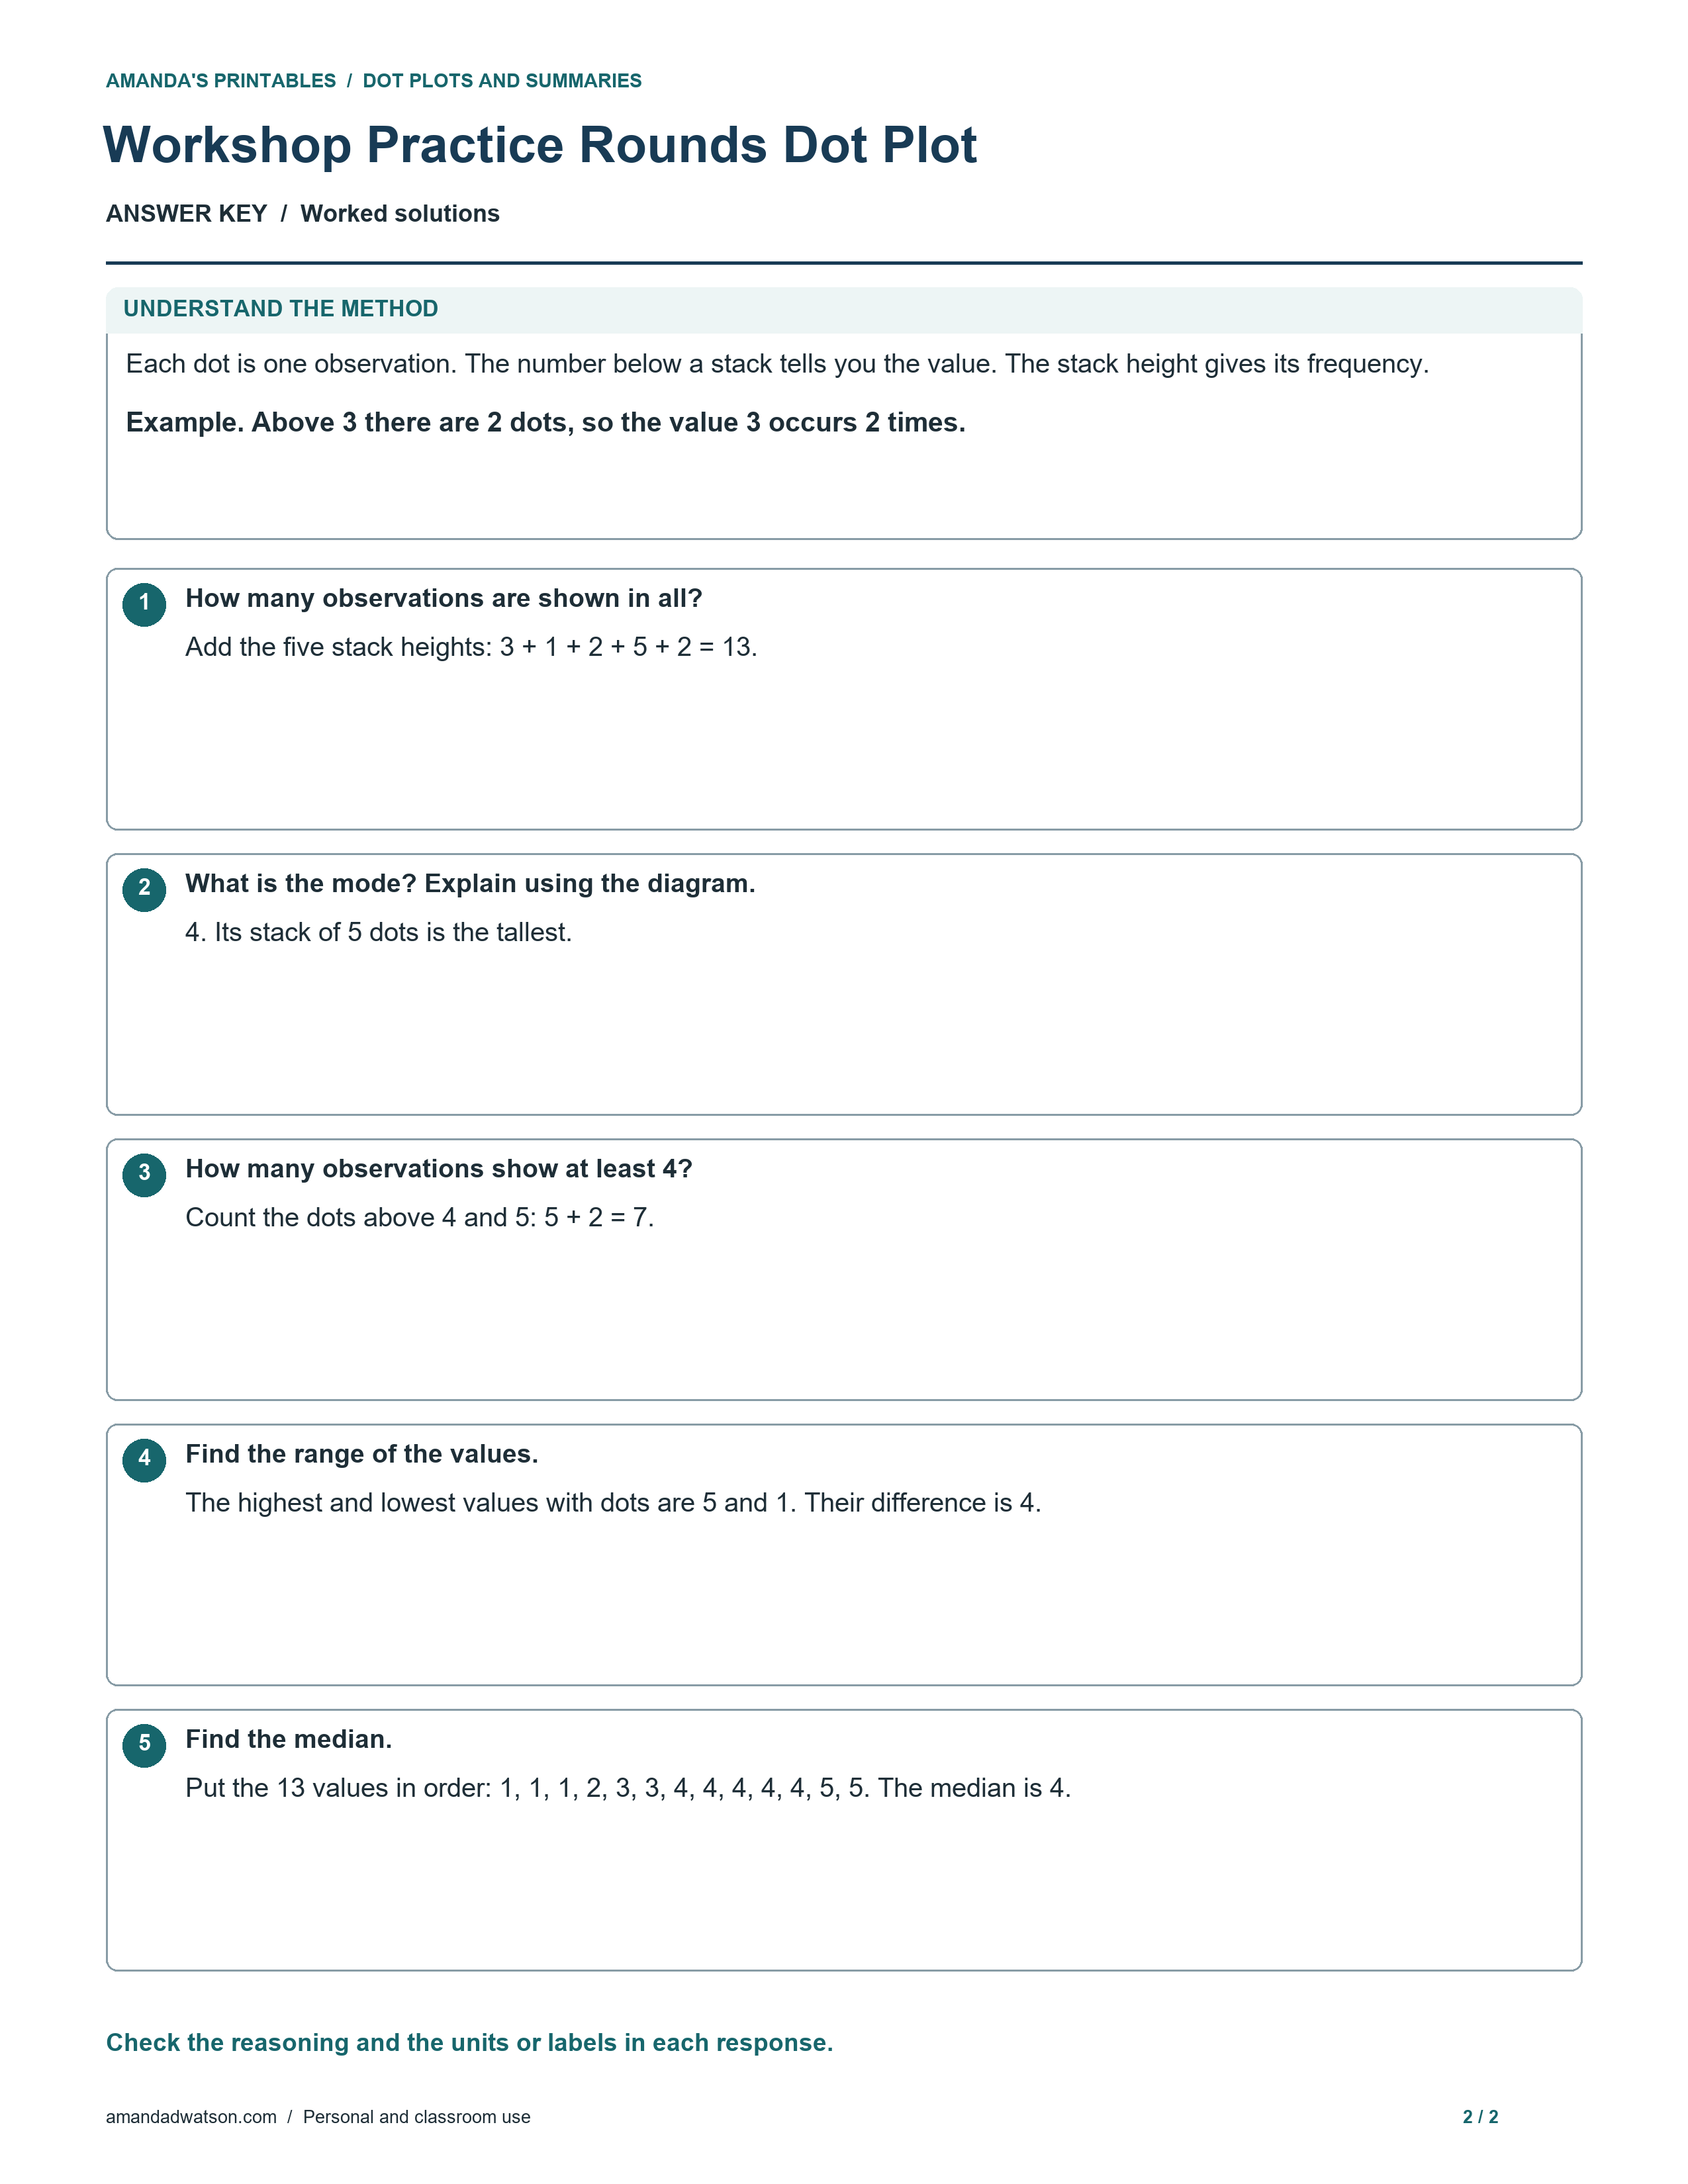
- Add the five stack heights: 3 + 1 + 2 + 5 + 2 = 13.
- 4. Its stack of 5 dots is the tallest.
- Count the dots above 4 and 5: 5 + 2 = 7.
- The highest and lowest values with dots are 5 and 1. Their difference is 4.
- Put the 13 values in order: 1, 1, 1, 2, 3, 3, 4, 4, 4, 4, 4, 5, 5. The median is 4.
Download the student sheet and key
Each page has its own Download image and Download PDF controls. Choose US Letter or A4 for the PDF. Match the paper size in the print dialog and check the page edges before printing. The original PNGs are 2550 × 3300 pixels at 300 dpi. The pages are free for personal and classroom use.