
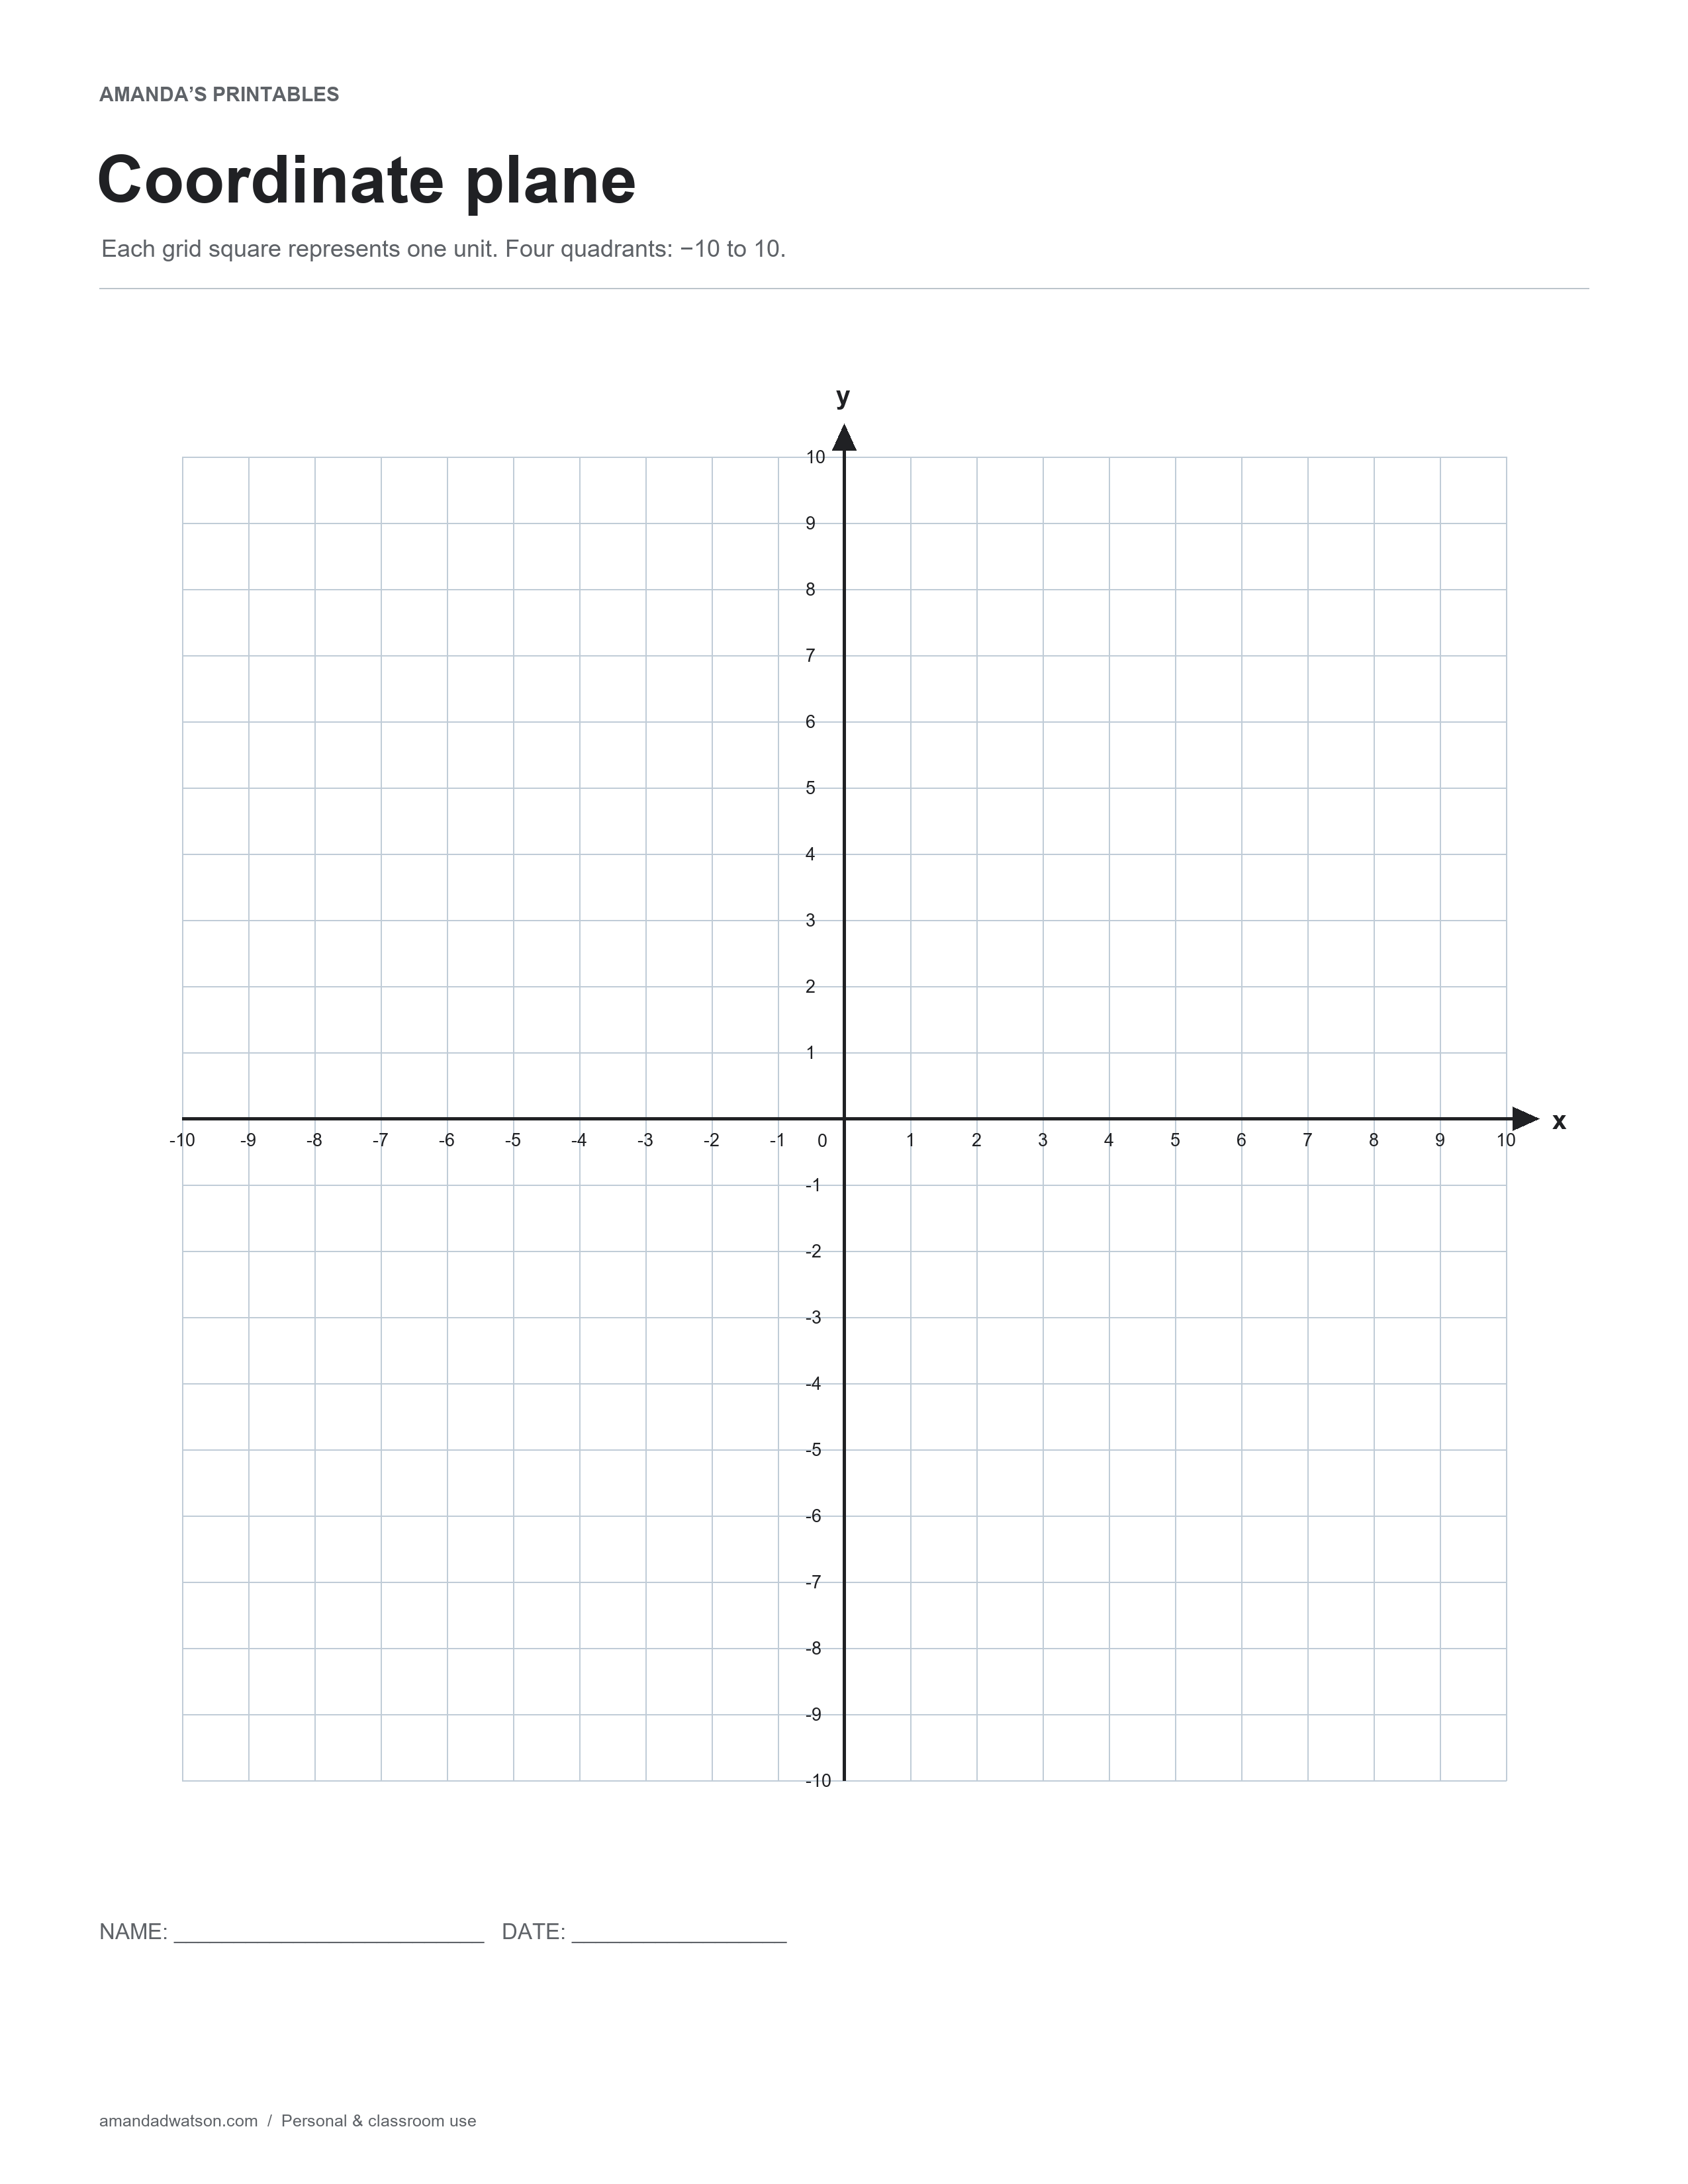
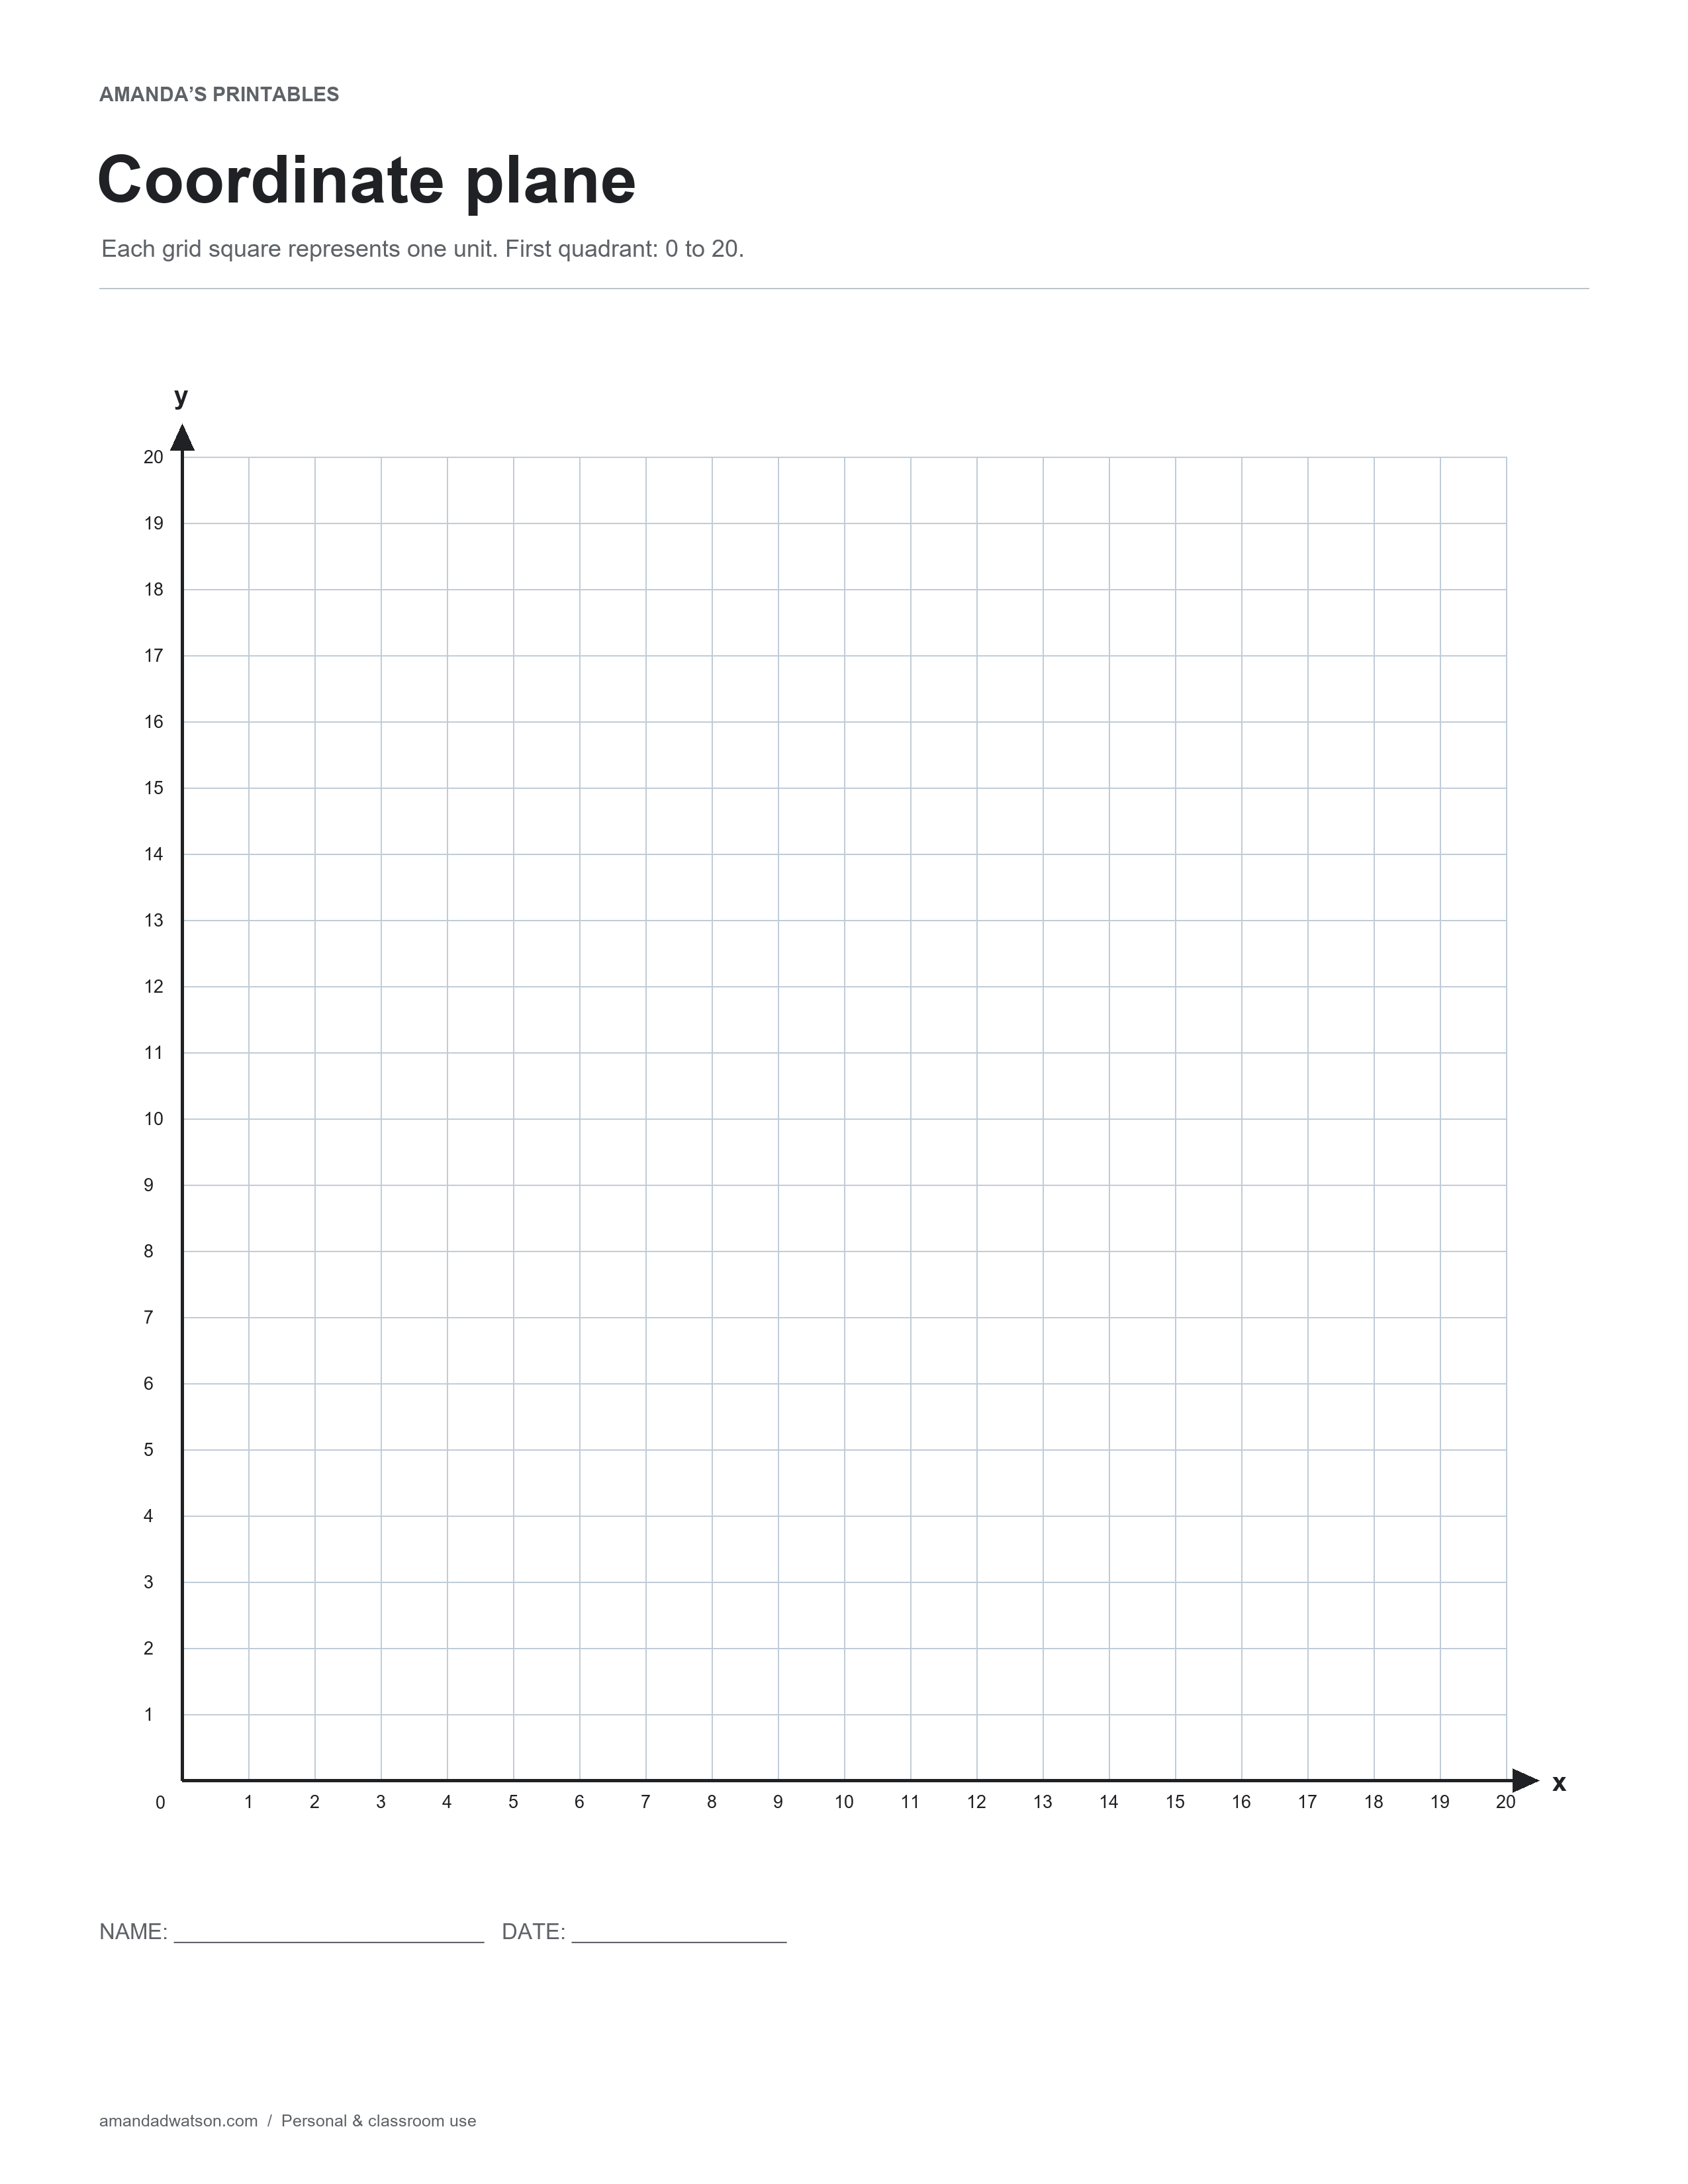
Use these printable coordinate planes to practice plotting points and reading ordered pairs. The set includes a four-quadrant grid from −10 to 10 on both axes and a first-quadrant grid from 0 to 20. Each square represents one mathematical unit.
The axes are numbered, but there are no pre-plotted points or graphs. Add the points, shapes, or examples that match your activity.
Four-quadrant coordinate plane
This grid places the origin where the horizontal x-axis and vertical y-axis meet in the center. Positive and negative values appear on both axes. It is suitable for activities that need points on either side of zero.
First-quadrant coordinate plane
The first-quadrant version places the origin at the lower left of the grid. Both axes run from 0 through 20. Choose it for an activity using nonnegative coordinates in that range.
Plot an ordered pair
Read a point as (x, y). Start at the origin, use the first number to move horizontally, and then use the second number to move vertically. To plot (−3, 4), move three units left and four units up. To plot (5, 2), move five units right and two units up.
Use the numbered intervals rather than the physical size of a printed square. Fitting an image to a paper size can change its dimensions, but the coordinate scale remains one unit per grid square.
Activities to try
- Plot (2, 3), (6, 3), (6, 7), and (2, 7), then connect them in that order and return to the first point.
- On the four-quadrant grid, compare (3, 2) and (−3, 2). Explain which coordinate changed and how their positions relate to the y-axis.
- Choose a point on an axis and identify which coordinate is zero.
- Write the coordinates of a point before asking another person to plot it.
Check an activity
For the first set of four points above, the connected shape is a square with sides four units long. The points (3, 2) and (−3, 2) are reflections across the y-axis. A point on the x-axis has a y-coordinate of zero, while a point on the y-axis has an x-coordinate of zero.
Download and printing
Save the original PNG or select US Letter or A4 below the image to generate a PDF. Check that the smaller axis labels are readable on a test print. The template is a flat image without interactive graphing features.
The original grids are free for personal and classroom use. Please share the article link rather than reselling or redistributing the files.