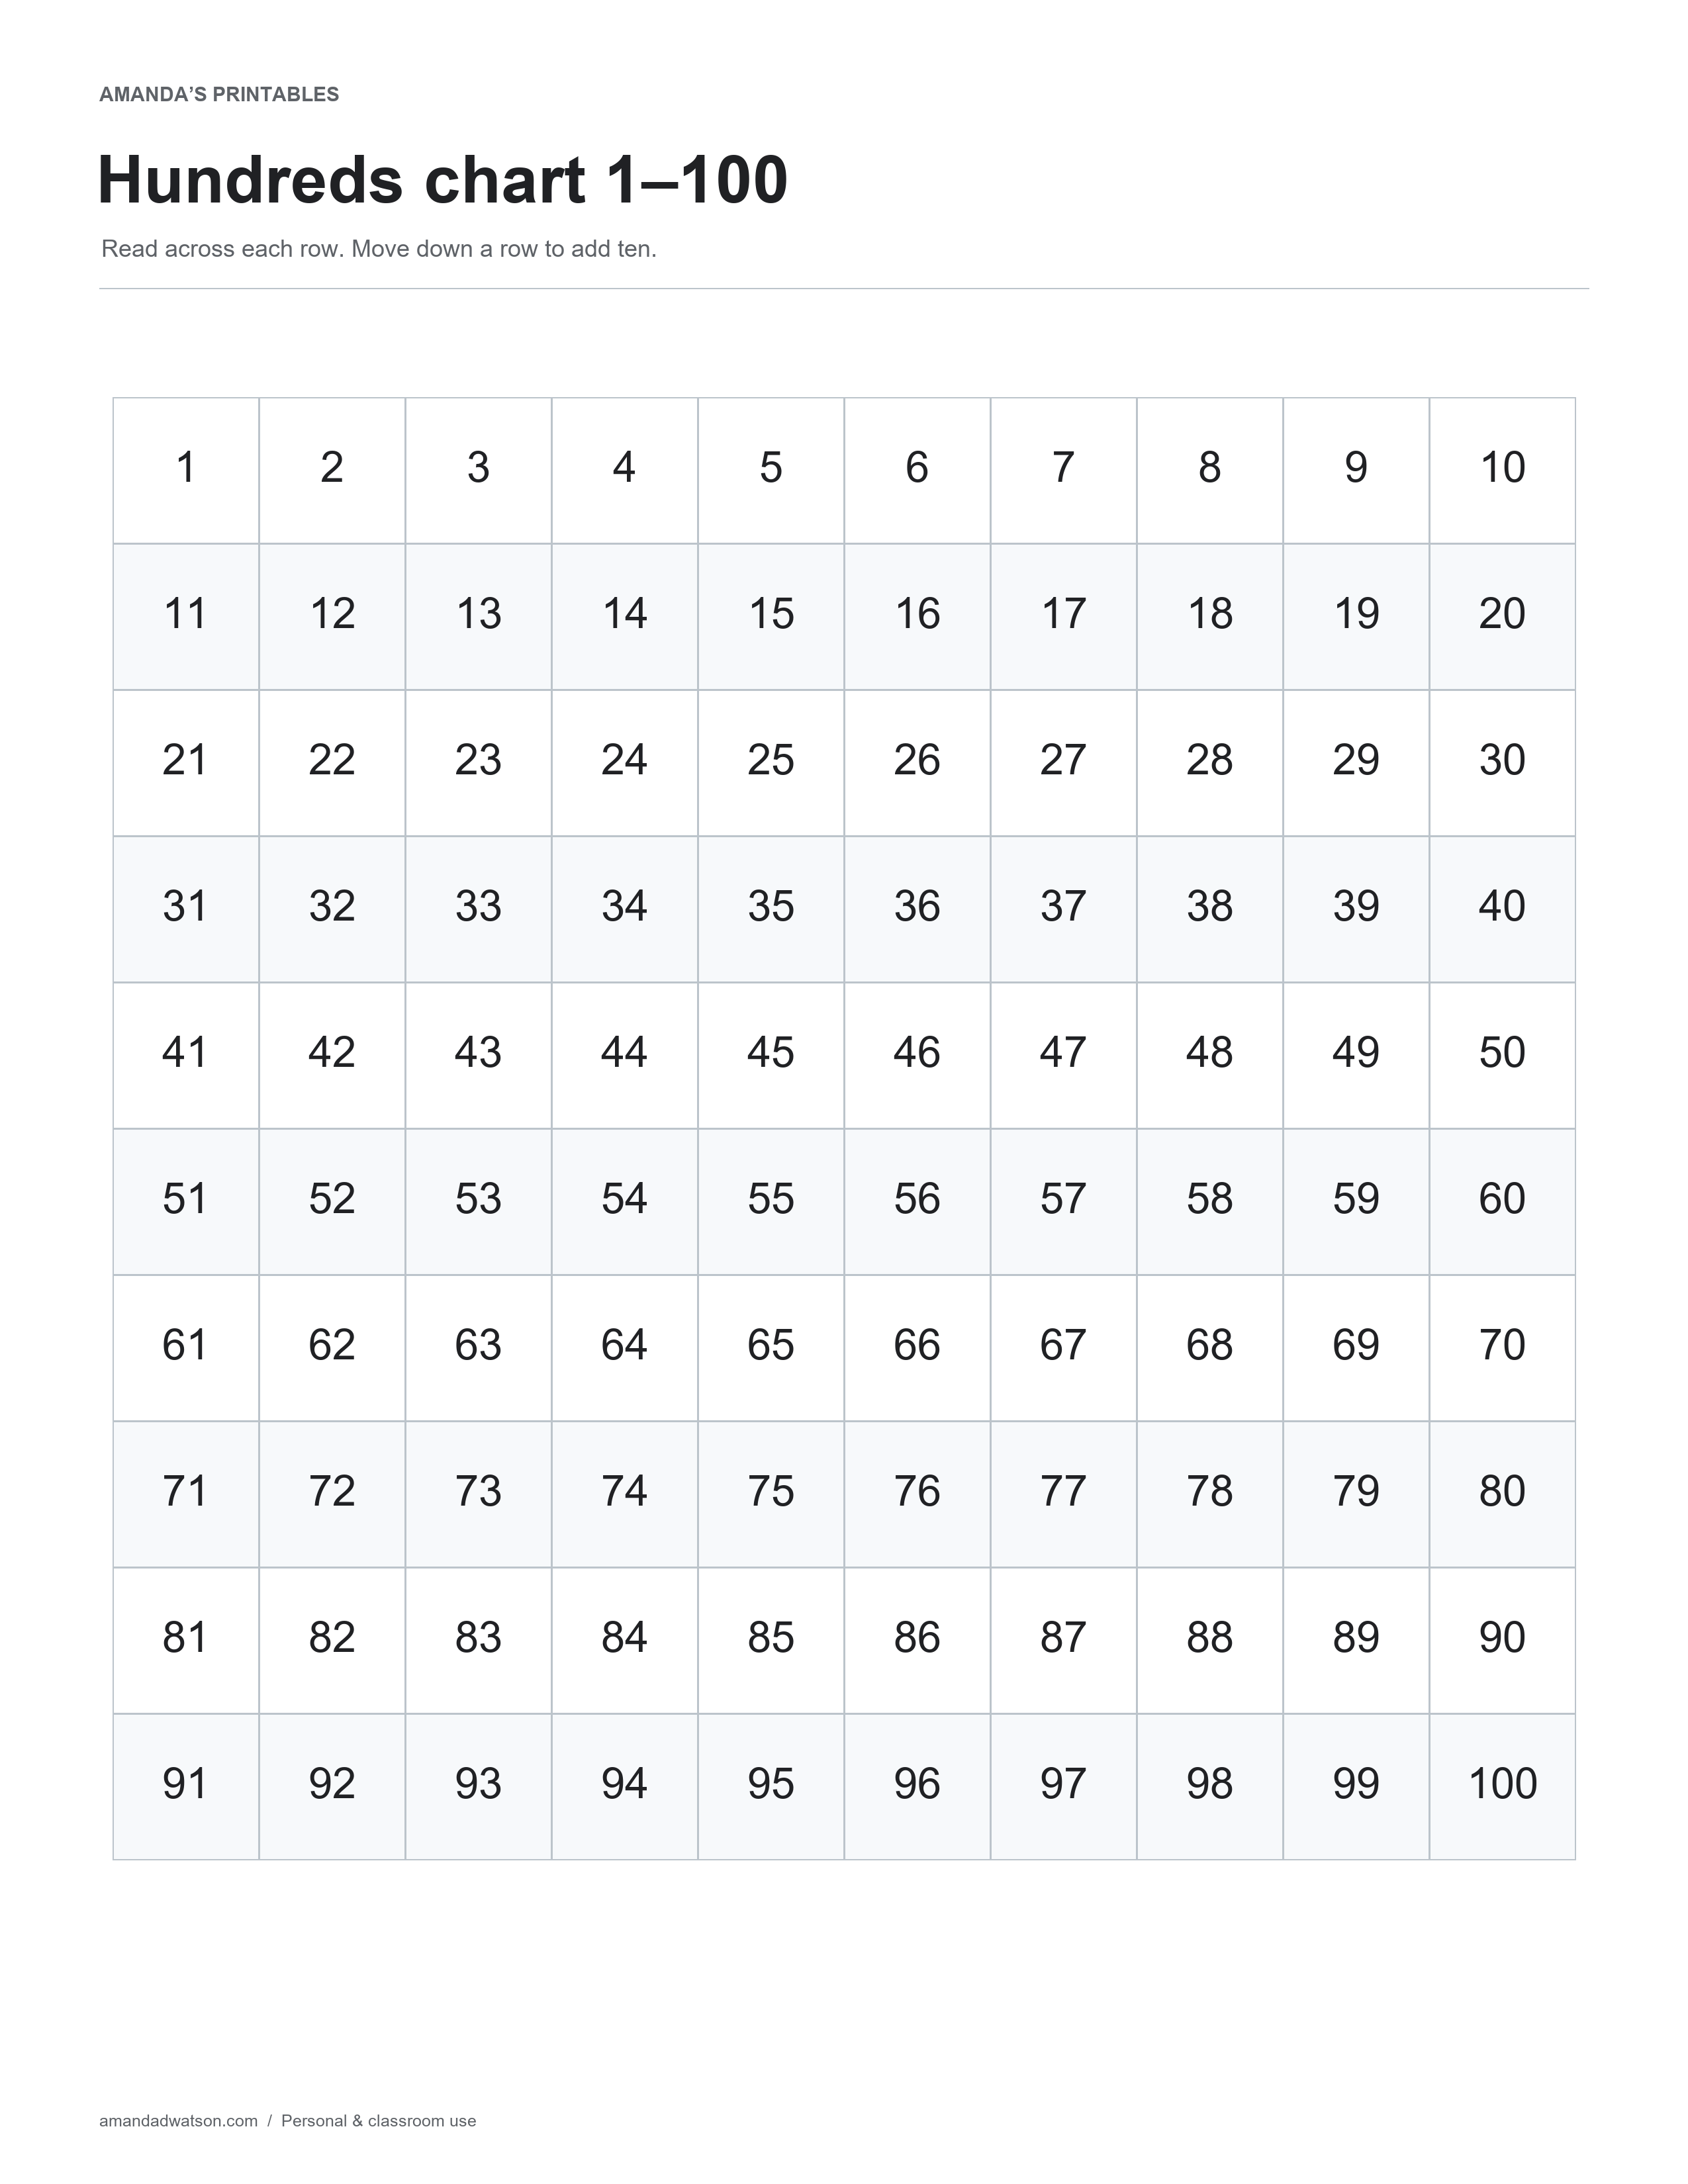
A printable hundreds chart gives learners a clear view of numbers from 1 to 100. This set includes a completed chart and a practice version with four anchor numbers. Both use a ten-by-ten grid, with numbers increasing from left to right across each row.
Use the completed page to read and compare numbers. Then try the practice grid when a learner is ready to fill in more of the sequence.
Completed 1–100 number chart
The first row contains 1 through 10, and the last row contains 91 through 100. Each row has ten numbers. Moving down one cell in the same column adds 10; moving up one cell subtracts 10.
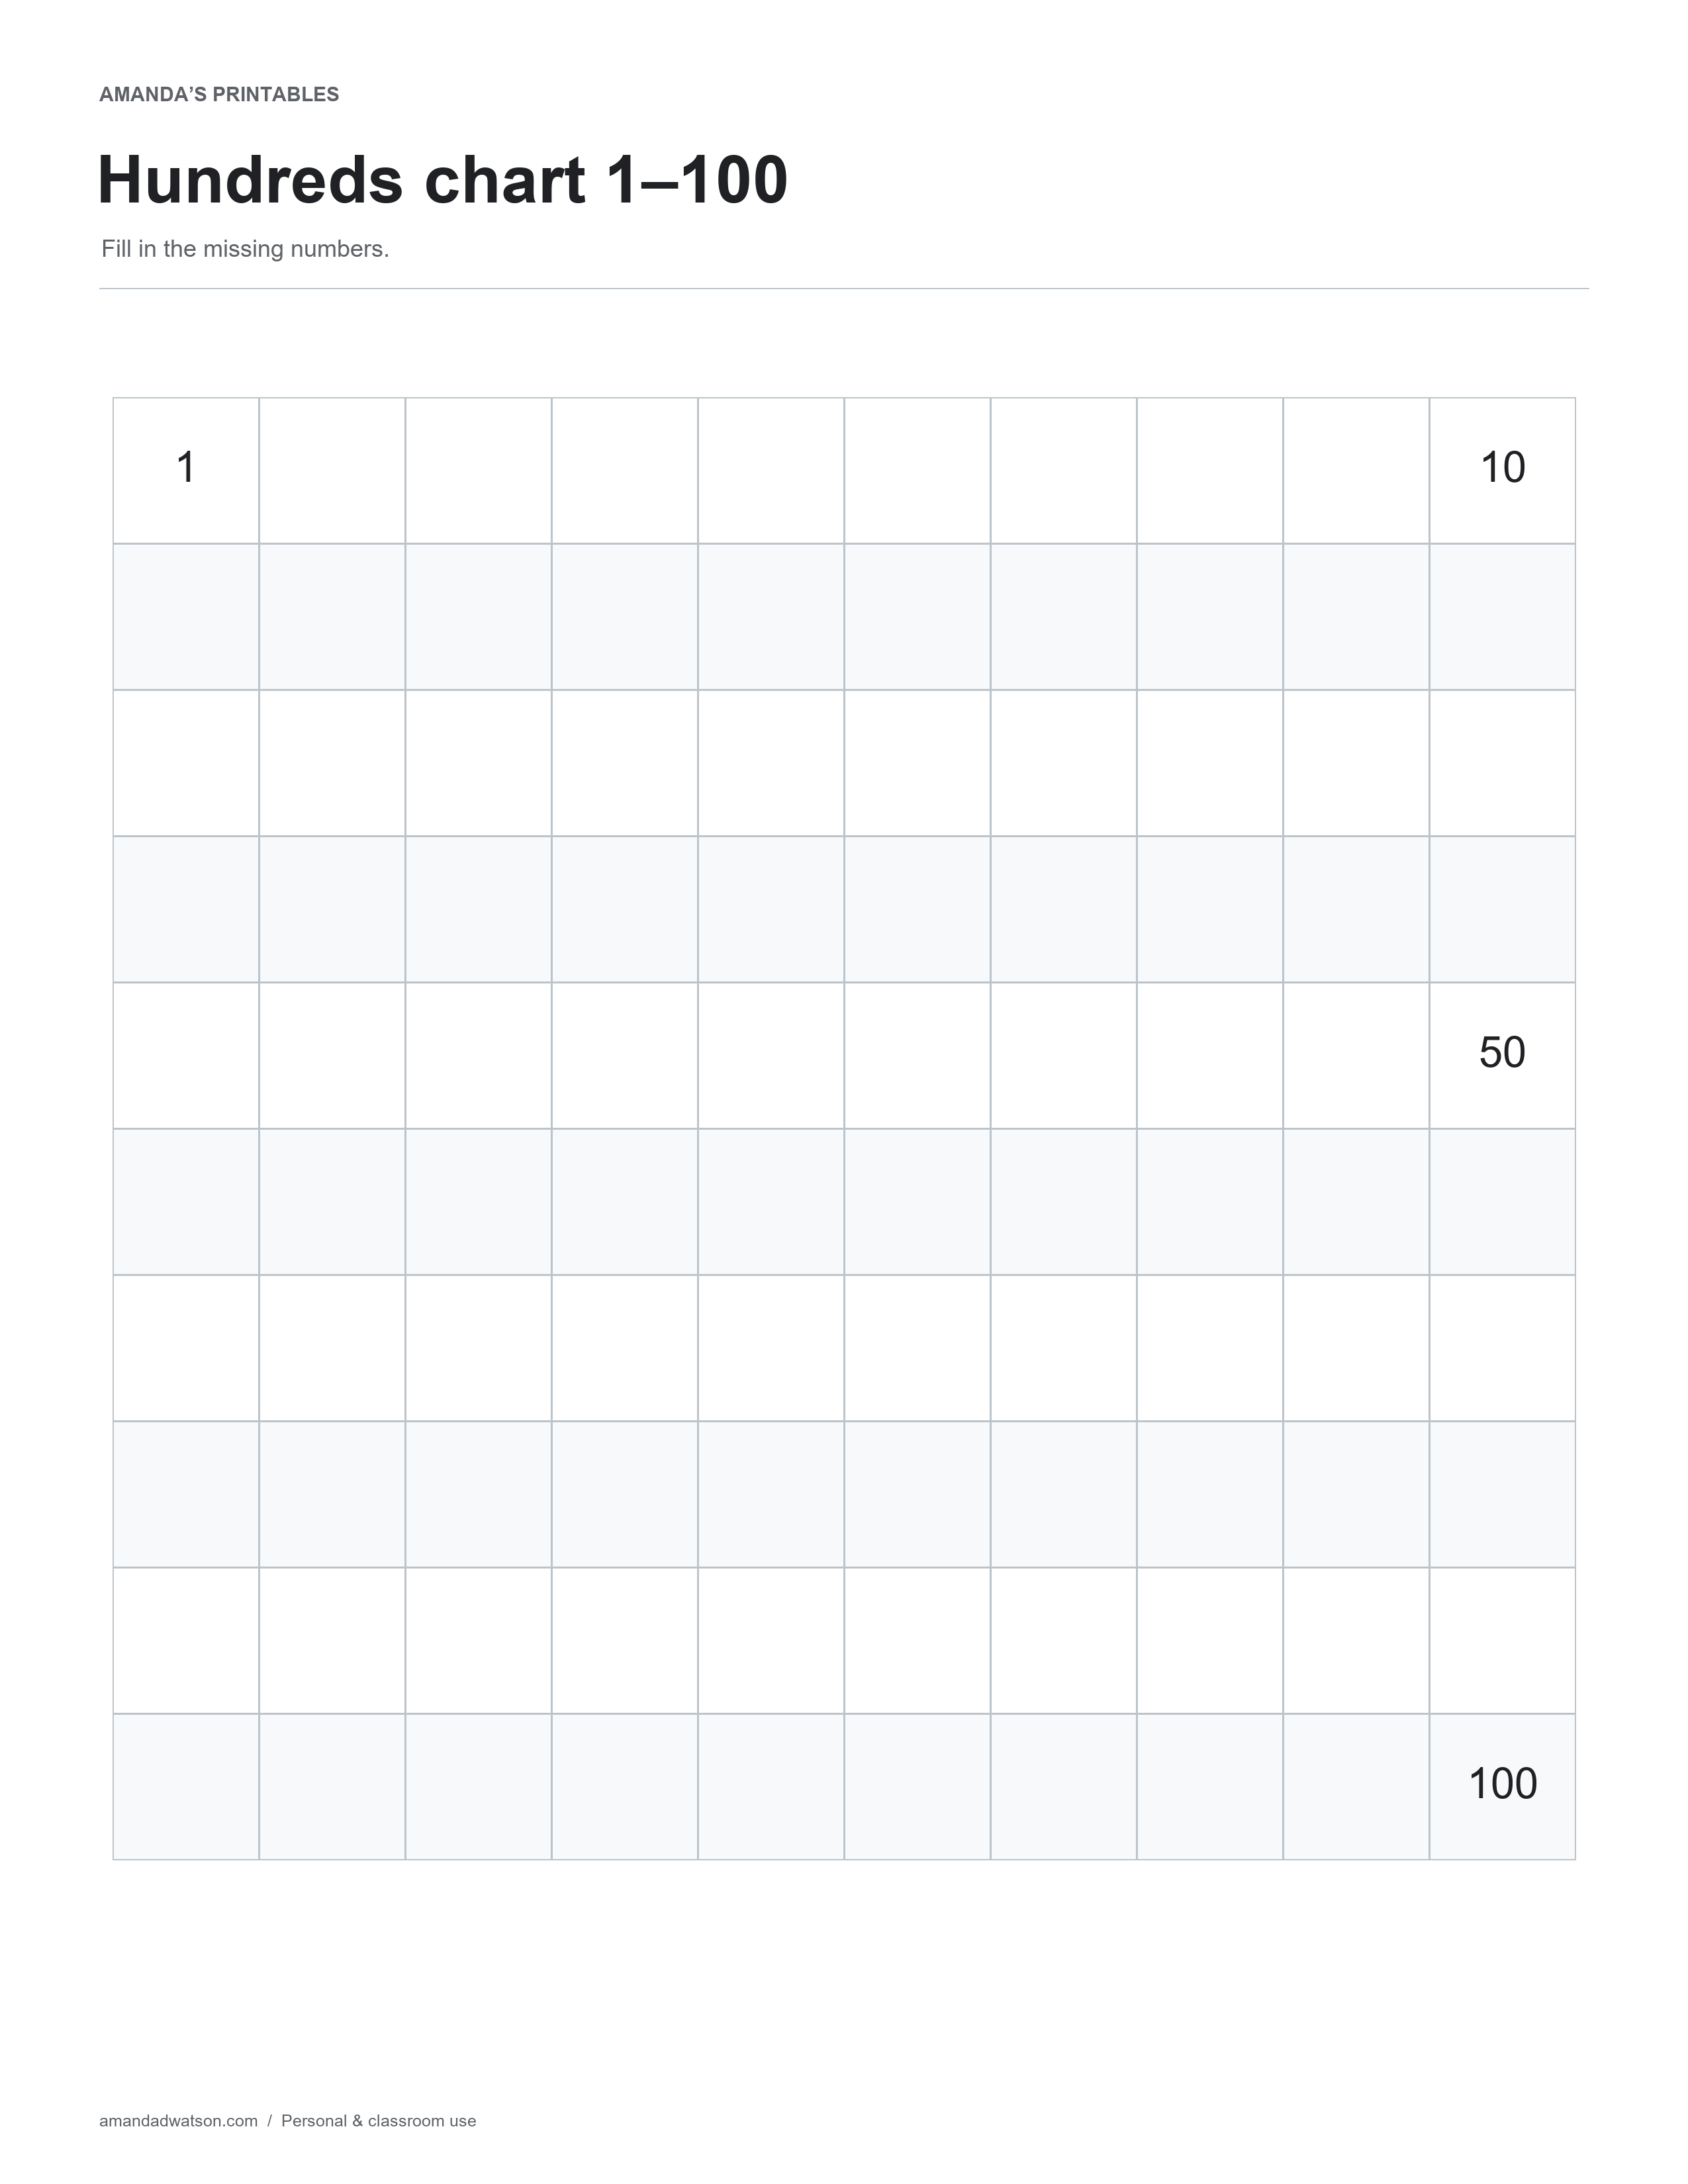
Missing-number practice chart
The practice page includes 1, 10, 50, and 100 as reference points. The remaining cells are blank. Begin by completing one row or column, or fill in the numbers around an anchor such as 50.
Activities to try
- Find a named number. Say a number and ask the learner to locate it, then read the numbers immediately before and after it.
- Compare neighboring cells. Start at 34. One cell to the right is 35, and one cell below is 44. Discuss why the changes are different.
- Look at a column. Read 6, 16, 26, and the numbers below them. Notice the repeated ones digit.
- Build a section. On the practice page, complete a small area around a known number before filling the entire chart.
A note about row boundaries
Moving right adds one within a row, but the next number after the rightmost cell begins the next row at the left. For example, 10 is at the end of the first row and 11 begins the second. The chart is a grid arrangement of the counting sequence, not a loop around its edges.
Use the completed page as an answer key
Compare a completed practice row with the reference page. If a number is in the wrong position, trace the row back to its starting number and count forward again. Encourage the learner to explain the sequence rather than only checking whether a written number appears somewhere on the page.
Download and printing
Save the original PNG or generate a US Letter or A4 PDF using the controls beneath each image. The numbers stay in the same positions when the image is scaled. Check the print preview and choose the paper size that matches your PDF selection.
The charts are free for personal and classroom use. Please share this article’s link when recommending them, and do not resell or redistribute the files.